Go to sdss.org
DR7 Home
Where to Start
Data
   Database (CAS)
   Files (DAS)
   Value-Added
   Tutorials
   Older Releases
About DR7
   Sky Coverage
   Instruments
   Data Processing
   Algorithms
Help
   FAQ
   Glossary
   Known Issues
   DR Papers
   Helpdesk
   Search

Imaging camera parameters and description

Introduction

A detailed description of the imager can be found in Gunn et al. (1998) and in the project book. This page summarizes the most important information needed to understand the data it produces:

Imaging camera parameters

Photometric CCDs 30 2048 × 2048 SITe/Tektronix 49.2 mm square CCDs, arranged in 6 columns parallel to the scan direction and 5 rows perpendicular to the scan direction
CCD read noise < 5e- pixel-1 (overall system is sky limited)
Image frame size 2048 × 1361 pixels (13.51 × 8.98 arcminutes)
Image column separation 25.17 arcminutes
Detector separation along column 17.98 arcminutes
Focal-plane image scale 3.616 mm arcmin-1
Detector image scale 3.636 mm arcmin-1
Pixel size and scale 24 μm; 0.396 arcseconds pixel-1
Filters r i u z g scanned in that order, 71.7 seconds apart
Integration time 54 s
Operating mode drift scan
Field distortion <0.1 arcseconds over the entire field
Field size 2°.5
Flux calibration Standard-star fields at 15° intervals along scans, tied to BD + 17° 4708, atmospheric extinction determined by the PT
Astrometric CCDs 22, 0.25 × 2 inches, above and below CCD columns; r filter plus 3 mag neutral density filter, 10.5 second integration time

Transmission curves

The photometric flux calibration web page is essential reading for those wishing to understand the SDSS photometric system. There is a long page describing transformations between SDSS (ugriz) and Kron-Cousins (UBVRcIc) photometry.
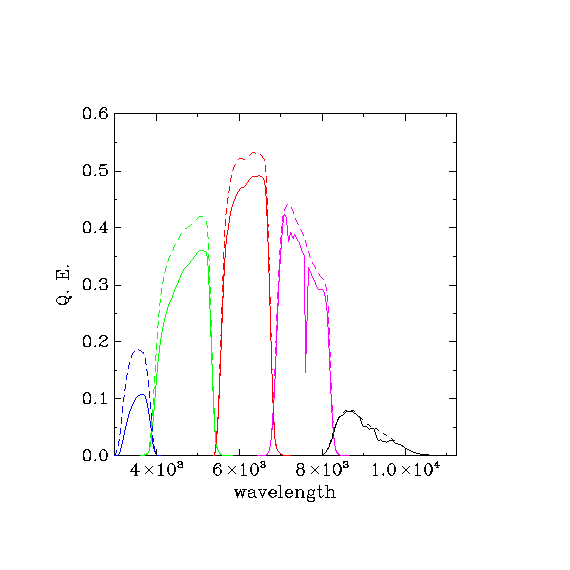
Average wavelengths of SDSS filters
u g r i z
3551Å 4686Å 6165Å 7481Å 8931Å

SDSS system response plot

The solid response curves show the througput defining the survey's photometric system, which includes extinction through an airmass of 1.3 at Apache Point Observatory. For reference, the dashed curves do not include any atmospheric extinction. These are sometimes loosely referred to as "filter curves" although they do include the full system response from atmosphere to detector.

filter curves for ugriz filter set

Repeat photometry of most stars in stripe 82 is stable with time by 0.01 mag (Doi et al. 2010, arXiv:1002.3701). The response of each CCD and filter is also available.

Tables

Tables of camera sensitivity through each filter are available as html tables and as ASCII tables: u.dat g.dat r.dat i.dat z.dat

The columns of the table represent:

  1. wavelength
  2. on the sky sensitivity looking through 1.3 airmasses at APO for a point source. These define the survey's photometric system.
  3. sensitivity under these conditions for very large sources (size greater than about 80 pixels) for which the infrared scattering is negligible (the infrared scattering only affects the thinned detectors used for ugri and among these, it is negligible for ug; hence this column is different from column 1 only for ri)
  4. the response of the third column with no atmosphere
  5. assumed atmospheric transparency at one airmass at Apache Point Observatory

Variation

The response functions of the SDSS imager as a function of wavelength have been monitored throughout the survey. The griz responses were stable over time, although very small seasonal (i.e., temperature) variations were observed, at a level well below our typical photometric errors. However, we have found a relatively large change in both the amplitude and shape of the u-band response, which is likely due to a degradation of the UV enhanced coating of the u-band CCD. This change in instrumental zero-point is effectively corrected by the photometric calibration for objects near the mean color of the standard stars, and, in fact, the repeat photometry of stars in stripe 82 is stable with time for stars with -0.5Arrangement of CCDs on the camera

Arrangement of CCDs on the imager photo of the imager CCD arrangement


*Text and figures on this page come from an author-created, un-copyedited version of the SDSS Data Release 7 paper, an article submitted to Astrophysical Journal Supplements. IOP Publishing Ltd is not responsible for any errors or omissions in this version of the manuscript or any version derived from it. A preprint of the DR7 paper is available from the arXiv preprint server.


Last modified: Mon Apr 10 21:31:08 BST 2006