
APOGEE Observations
APOGEE Observational Strategy
APOGEE acquires 300 spectra simultaneously in a single observation with state-of-the-art, cryogenic, near-infrared spectrographs. The actual spectral data acquisition relies upon plugplates, which are aluminum disks placed in the focal plane of the telescope. Each plate corresponds to a specific patch of sky and is pre-drilled with holes corresponding to the sky positions of objects in that area. A targeted area of the sky is covered by one or more unique plates. DR15 presents results for 823 different plugplates in 731 fields.
For a single star, significant variation in its radial velocity over time indicates the possible presence of a companion. Accordingly, the vast majority of APOGEE plugplates are observed multiple times on different nights to allow for the robust monitoring of radial velocity variations. A single observation is called a visit, and visits are identified with a plate number and the MJD (Modified Julian Date) on which that plate was observed. Plates with 3 or more visits are observed with a pre-determined cadence (i.e., the scheduling of multiple visits for a particular sky location over a set timeline).
Plate Plugging
To begin the observation of a plate, fibers are plugged into pre-drilled holes and the fibers then are mapped by shining a laser on the slithead to determine which fibers correspond to which holes (and therefore to which stars). These mapping data are incorporated into one of the Header and Data Units (HDUs) of the apPlate file described below.
Each hole on a plate corresponds to a single object on the sky. The fibers plugged into the plate holes bring the light from the telescope focal plane to the (pseudo)slit of the spectrograph. Accordingly, each object spectrum is also referenced by the number of the fiber (fiberID) at the pseudoslit with which it was collected. Plates used by the APOGEE survey have 300 fibers.
Raw Data Collection
A cartridge containing the plugged plate is mounted on the telescope and the telescope is slewed to the designated plate location. Calibration frames (darks, arcs, flats) are acquired at the beginning and end of nightly observations. The telescope field acquisition and guiding are performed and then, a standard observation sequence commences consisting of a dark, a flat, and an exposure series. A standard-length observation is a series of 8 exposures of 500 seconds a piece. Note that the exposure number can vary based on target faintness (for such targets a double-length exposure sequence is employed), available time, observing conditions, etc.
The resolution of the APOGEE spectra in comparison to the pixel size of the APOGEE detectors causes the spectrum from a single exposure to slightly undersample the resolution at the short wavelength end. To avoid the challenges of working with undersampled data, APOGEE spectra are taken in pairs, with the detectors shifted slightly (by a distance of one half of a detector pixel) between the two exposures of the pair.
This shifting is referred to as dithering, and each "dither pair" of exposures includes observations at these offset dither positions. A standard 8-exposure APOGEE observing sequence consists of exposures at the two differ dither positions (A and B) and typically taken in the pattern ABBA ABBA. The data reduction pipeline requires exposures in dither pairs so that any unpaired exposure is discarded.
The APOGEE infrared detectors have the capability to be read "non-destructively", meaning that the amount of charge per pixel can be detected without affecting that charge. This permits the levels on the detectors to be measured during the exposure. While readout noise can be significant for a single read of the detectors, the ability to read them multiple times during an exposure allows for a reduction in the net readout noise in the final exposure. For APOGEE, the detectors are read in an "up-the-ramp" mode where the detectors are read every 10.7 seconds. Thus, a single exposure generally consists of 47 readouts over an exposure time of 500 seconds. Because of the multiple readouts, the raw APOGEE data for an exposure are actually in a "data cube", with two of the dimensions representing the location on the detectors and the third dimension representing the time sequence.
Observational Data Products
If a plate is observed on more than one MJD, the fibers will be replugged. It is possible for the same plugplate that a given fiberID on different MJDs can correspond to different objects on the sky, and the same star could be observed with a different fiberID at each visit. The individual visit spectra for objects are available in apVisit FITS files.
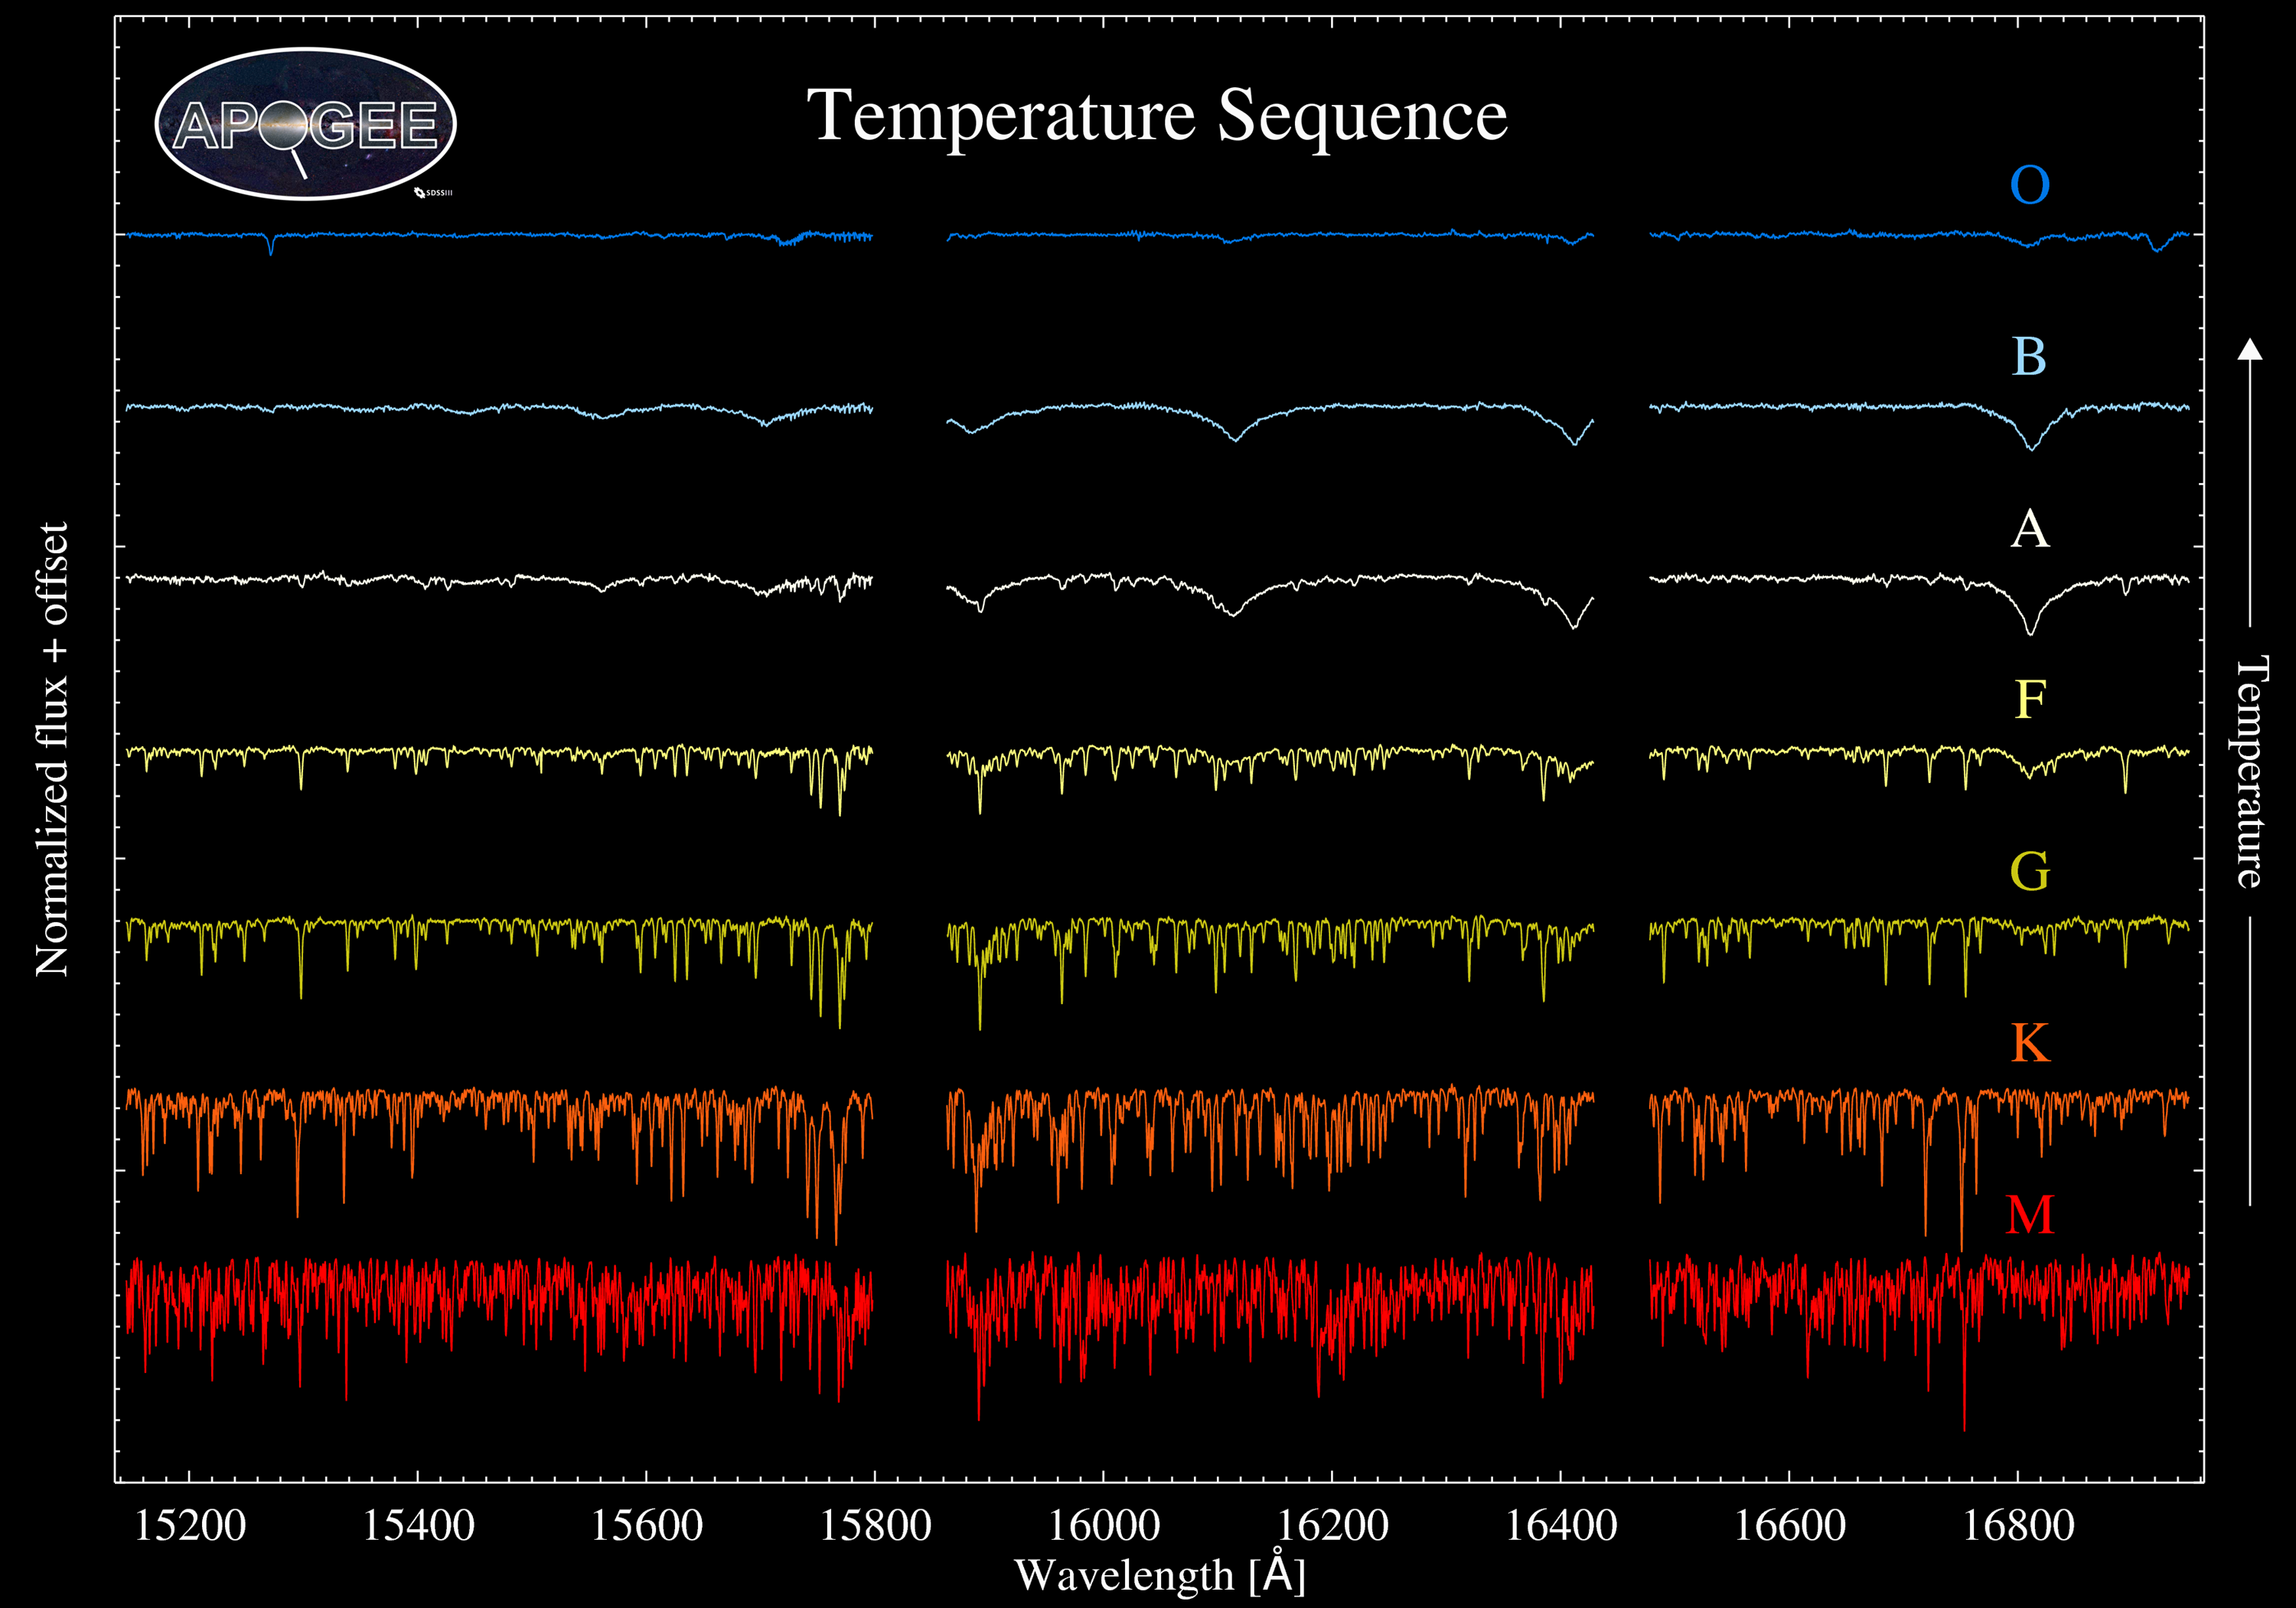
In addition to the individual visit spectra, the sum of these spectra is available. The APOGEE software pipeline co-adds the spectra for each particular star coming from different visits to the same field to produce a higher signal-to-noise spectrum of each object. These combined spectra are identified by the catalog name of each star. The APOGEE sample is selected almost exclusively from the 2MASS catalog, and thus the stellar identifications are by their APOGEE ID, which basically just encodes the position of the star on the sky from the Two Micron All-Sky Survey (2MASS). The combined spectra are a primary data product of the APOGEE survey. As described in the data access description, the combined spectra are provided in apStar files in FITS format. The image to the right shows examples of some typical APOGEE spectra for stars of different spectral types.
There are certain factors that should be taken into account when looking at APOGEE spectra such as various instrumental features and the still-developing state of the reduction pipeline as well as the nature of infrared observing itself. For more information about these important considerations, consult the following links: Using APOGEE Spectra and APOGEE pipeline.

