How to View Data with Marvin
Here we show some simple examples of how to view MaNGA spectral data using Marvin, a new python module specifically to download, analyze, and visualize MaNGA data. If you're using Marvin for the first time, you'll want to follow the instructions to install the package and configure it to automatically download data.
RSS
The tools to work with RSS files are currently in development. When available, we will update the tutorial accordingly.
Cube
To load a cube into Marvin, first load the Cube tool and then instantiate the cube
from marvin.tools.cube import Cube
cube = Cube(plateifu='7443-12703')
We can easily pull out a spectrum at any and plot it.
spaxel = cube.getSpaxel(0,0)
spaxel.flux.plot()
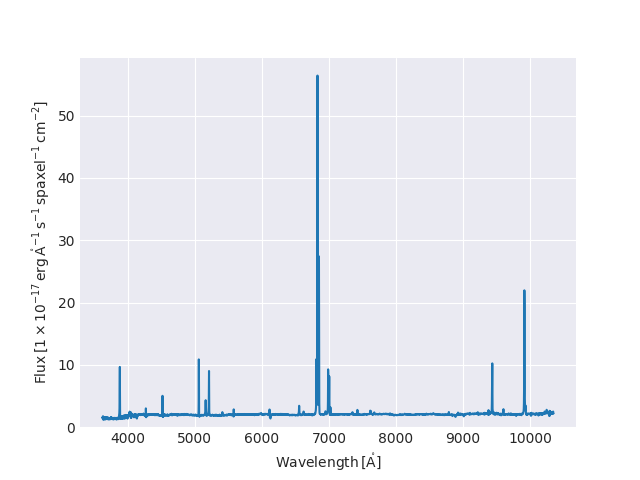
Alternatively, you can pull out a spectrum using on-sky coordinates
spaxel=cube.getSpaxel(ra=229.525575871,dec=42.7458424664)
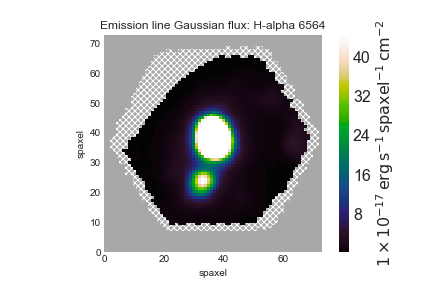
Plot an Hα narrow band image
With the release of the Data Analysis Pipeline (DAP) products, several narrow-band images of key spectral features have already been created. First, we need to access the Maps for our objects:
maps = cube.getMaps()
There are two types of narrow-band images: one generated from Gaussian fits to the emission lines (the "emline_gflux" extension), and one that simply sums up the channels around each emission line (the "emline_sflux" extension). Let's plot the latter:
hamap = maps.getMap('emline_sflux',channel='ha_6564')
hamap.plot()