
BOSS: Dark Energy and the Geometry of Space
(Illustration courtesy of Chris Blake and Sam Moorfield.)
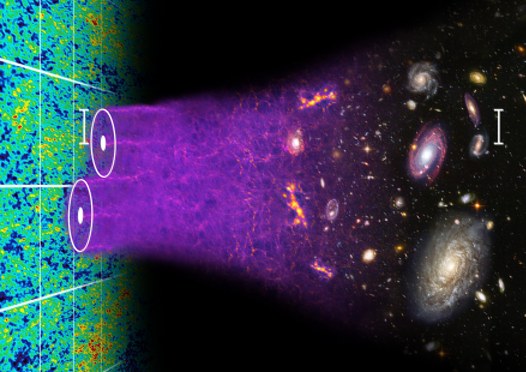
The SDSS's Baryon Oscillation Spectroscopic Survey (BOSS) mapped the spatial distribution of luminous red galaxies (LRGs) and quasars to detect the characteristic scale imprinted by baryon acoustic oscillations in the early Universe. Sound waves that propagate in the early Universe, like spreading ripples in a pond, imprint a characteristic scale on cosmic microwave background fluctuations. These fluctuations have evolved into today's walls and voids of galaxies, meaning this baryon acoustic oscillation (BAO) scale (about 150 Mpc) is visible among galaxies today. This concept is illustrated on the right (some of the relative scales have been exaggerated for illustration purposes).
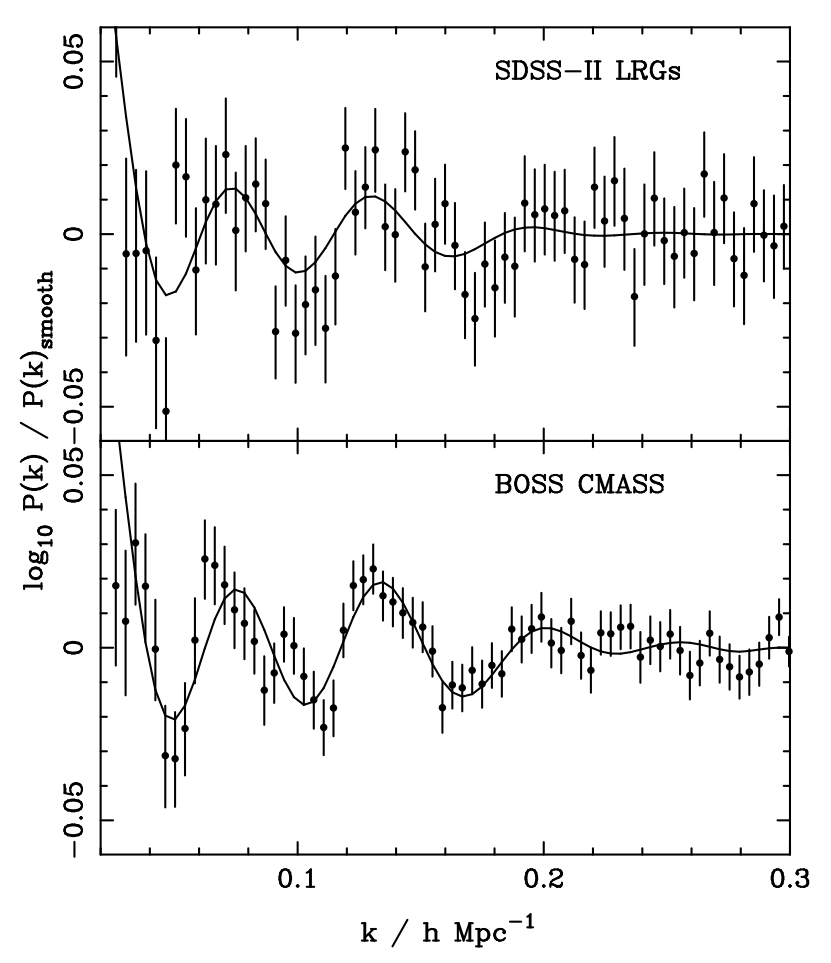
These baryon acoustic oscillations have now been measured in the distribution of galaxies as illustrated on the left, where we show the power spectrum of galaxy fluctuations as a function of scale (shown here as a wave number, k). We have removed the smooth component to more clearly show the oscillations, which are the BAO signal of interest. The two panels show the previous results from SDSS-II DR7 LRGs (top) and the new results from the z = 0.55 BOSS DR9 sample (CMASS, bottom). The reduction in errors and the better fit to the cosmological model (solid line) of the BOSS data compared to the SDSS-II is clearly evident.
Using the acoustic scale as a physically calibrated ruler, BOSS has determined the angular diameter distance with a precision of 1% at redshifts z = 0.3 and z = 0.55 using the distribution of galaxies. BOSS has also measured the distribution of quasar absorption lines at z = 2.5, yielding a measurement of the angular diameter distance at that redshift to an accuracy of 1.5%, and measured the cosmic expansion rate H(z) with 1-2% precision at the same redshifts. These measurements provide demanding tests for theories of dark energy and the origin of cosmic acceleration.
In addition to constraining cosmological models, BOSS has delivered an outstanding sample of galaxies and quasars ideally suited to probing the formation and evolution of galaxies in the Universe. For example, we show below an example z = 0.56 galaxy spectrum for early BOSS data, which shows the level of spectral detail on these intermediate redshift galaxies. By studying the various key absorption features in this spectrum (labeled and shown with red tickmarks), we can estimate the age and metallicity of the stars in these galaxies, and thus determine how and when they formed. The sheer size of BOSS, coupled with the BOSS spectrograph resolution, is greatly enhancing this area of science.
For a detailed description of BOSS, see Section 3 of the Project Description, available as a PDF document.
Working with BOSS data
There are some Basic Tutorials for accessing and viewing SDSS data available on this website.
There are descriptions of the target selection algorithms for galaxies and quasars available on the SDSS website too.

BOSS at a Glance
- Dark time observations
- Fall 2009 - Spring 2014
- 1,000-fiber spectrograph, resolution R~2000
- Wavelength: 360-1000 nm
- 10,000 square degrees
- Redshifts of 1.5 million luminous galaxies to z = 0.7
- Lyman-α forest spectra of 160,000 quasars at
redshifts 2.2 < z < 3
BOSS Galaxy Property Catalogs
BOSS papers
BOSS has submitted and/or published several papers which are listed on the SDSS-III BOSS Publications page.

