
MaStar Spectra
The spectra for all the good quality visit spectra can be accessed easily through the summary spectra file or individual spectra files.
Summary Spectra File
The mastar-goodspec-v3_1_1-v1_7_7-goodvisits.fits.gz file is available on the Science Archive Server at this link.
The file size is approximately 5 GB. We recommend using rsync to download the file, see the command on the Data Access page.
The naming convention is mastar-goodspec-[version1]-[version2], where [version1] and [version2] are the versions of the pipelines used to produce the file. [version1] is the version for the MaNGA Data Reduction Pipeline (v3_1_1 for DR17) and [version2] is the version for the MaStar post-processing pipeline (v1_7_7 for DR17).
The data model for the mastar-goodspec file is available here.
All of the high-quality spectra obtained for the MaStar targets are presented in this file. This file only includes the visits that were determined as high quality. This corresponds to the second extension ("GOODVISITS") of the mastarall summary file.
Each entry in the mastar-goodspec file contains the 1D spectrum (with wavelength given in vacuum), uncertainty, dispersion of line spread function, mask, identification, and observation information for a star from one night of observation, called one "visit". If a star has been observed on multiple visits, then there will be multiple entries for that star. Spectra from multiple exposures on one night have been combined together to give a single visit spectrum of the star for that night.
Spectral quality information is contained in the "MJDQUAL" flag, which follows the MASTAR_QUAL bitmask scheme. This provides quality information about the spectra. Here we list the meaning for each bit in the MASTAR_QUAL bitmask scheme.
| Bit name | Bit number | Decimal value | Description |
|---|---|---|---|
| NODATA | 0 | 1 | No Data. |
| SKYSUBBAD | 1 | 2 | Bad sky subtraction in one or more frames. |
| HIGHSCAT | 2 | 4 | High scattered light in one or more frames. |
| BADFLUX | 3 | 8 | Bad flux calibration. |
| LOWCOV | 4 | 16 | PSF-covering fraction by fiber is too small (<10%). |
| POORCAL | 5 | 32 | Poor throughput. |
| BADHELIORV | 6 | 64 | High variance between stellar RVs. |
| MANUAL | 7 | 128 | Flagged as problematic by visual inspection. |
| EMLINE | 8 | 256 | Spectrum contain emission lines. |
| LOWSN | 9 | 512 | Per-MJD Spectrum has median S/N <= 30 and 10th-percentile S/N <= 50. |
| MULTIFIBER | 10 | 1024 | Composite spectrum combined from multiple fibers. |
| BLOWTORCH | 11 | 2048 | Blowtorch artifact in one or more frames. |
| SEVEREBT | 12 | 4096 | Severe blowtorch artifact. |
| UPTURNRISK | 13 | 8192 | Risk of having a red-upturn. |
| REDUPTURN | 14 | 16384 | Red-upturn identified by visual inspection. |
| REDDOWNTURN | 15 | 32768 | Red-downturn identified by visual inspection. |
| NONSTELLAR | 16 | 65536 | Non-stellar spectrum based on visual inspection. |
| CRITICAL | 30 | 1073741824 | Critical failure in one or more frames. |
This file does not include stellar parameters or information from the input (targeting) catalogs. That information is provided in the MaStar Stellar Parameter Value Added Catalog.
Along with the mastar-goodspec file, we also provide a separate summary file, mastar-badspec-v3_1_1-v1_7_7.fits.gz for all the "bad" spectra that are considered to have quality issues or to have a high risk of having quality issues. It is available on the Science Archive Server at this link, with the data model here.
Uniform-Resolution Spectra
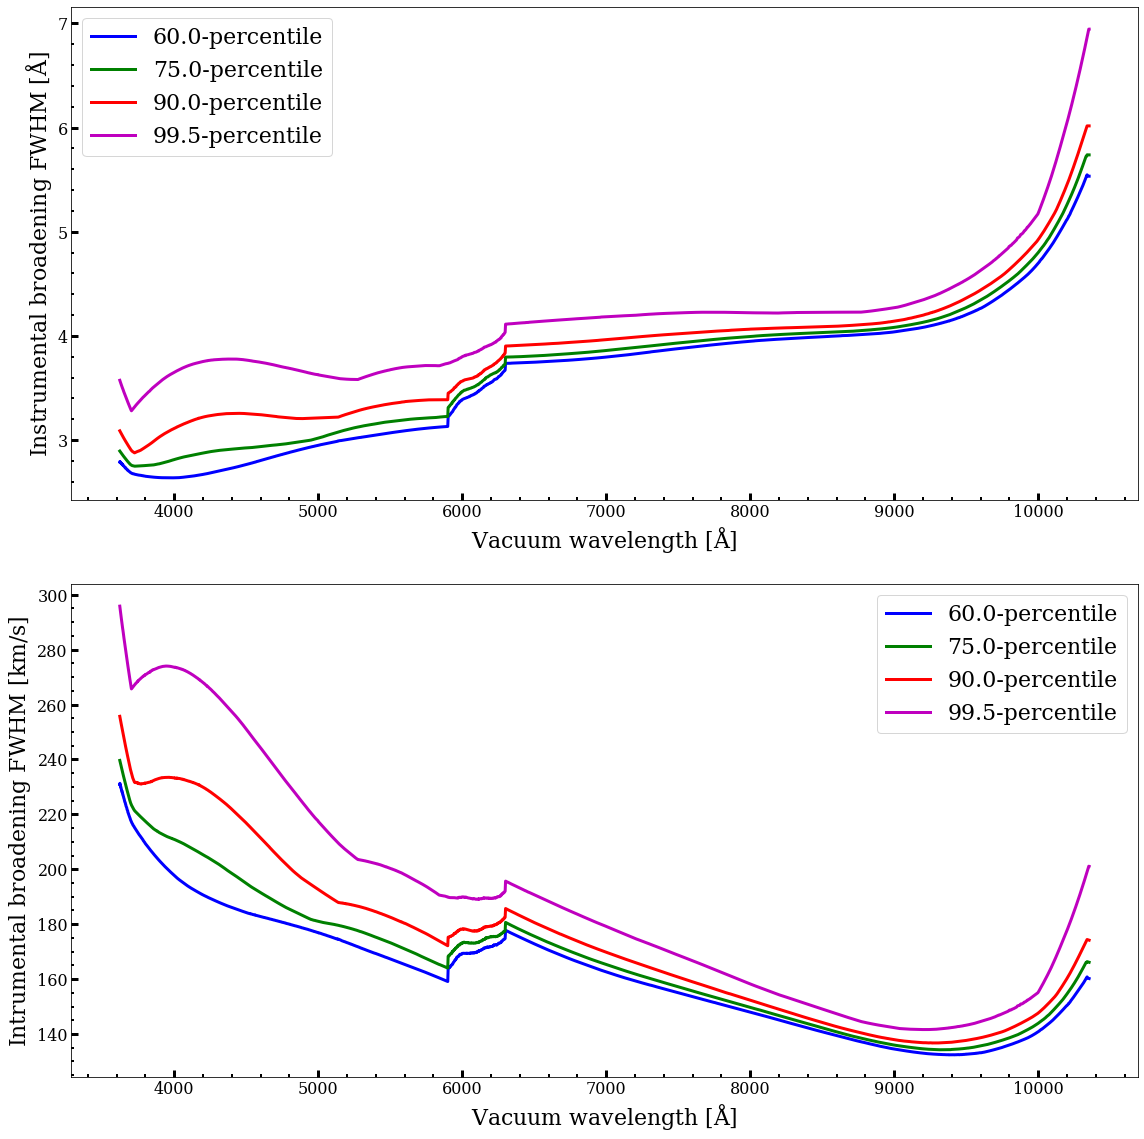
The spectral resolution of the spectra in the mastar-goodspec file varies with wavelength. The resolution curve also differs from star to star and from visit to visit. Since many applications require uniform resolution curves, we provide subsets of spectra that have been unified in their resolution curves, although still wavelength dependent. We define four such subsets and unified them to four different resolution curves. The four resolution curves are defined by four percentiles (99.5, 90.0, 75.0 and 60.0) of the resolution distribution at each wavelength among all good spectra. The percentile is counted from the highest resolution to the lowest resolution. The four resolution curves can be expressed in terms of the full-width-at-half-maximum (FWHM) of the line spread function (LSF). These four LSF FWHM curves are shown in the figure below. For each resolution curve, we selected visit spectra that have sharper LSFs (higher resolution) than it at all wavelengths and broadened their individual LSF curve to this common LSF curve.
- For the 60th percentile resolution curve, we have 8270 good spectra from 5090 unique stars, including 1844 unique science targets.
- For the 75th percentile resolution curve, we have 18,967 good spectra from 10,193 unique stars, including 4183 unique science targets.
- For the 90th percentile resolution curve, we have 39,760 good spectra from 18,469 unique stars, including 8245 unique science targets.
- For the 99.5th percentile resolution curve, we have 57,068 good spectra from 23,734 unique stars, including 11,546 unique science targets.
With the resolution curves made uniform, it is possible to combine multiple visits of the same star together to increase the signal-to-noise ratio. In addition to individual uniform-resolution spectra, we also provide combined spectra from multiple visits of the same star within the same LSF percentile. This provides one spectrum per unique MaNGAID with a higher signal-to-noise ratio.
These resolution-unified spectra and combined spectra can be found at this link.
The data model for these files can be found at this link.
Individual Spectra
Individual 1D spectra are also available through the Science Archive Server:
https://data.sdss.org/sas/dr17/manga/spectro/redux/v3_1_1/[PLATE]/mastar/mastar-LOG-[PLATE]-[IFUDESIGN].fits.gz
Where [PLATE] is the plate number and [IFUDESIGN] is the ID of the fiber bundle used to target this star.
Although we provide the ability to download individual spectra here, we recommend that users download the 'goodspec' file available above to avoid quality issues.
The data model for the mastar 1D spectra file is available here.
These files have 3 extensions:
- MASTAR: Combined spectra for each night of observation. Individual exposures from each night were combined together to give a single spectrum of the target for that night.
- OBSINFO: Observation information (airmass, seeing, PSF, etc.) for each individual exposure.
- FITDETAIL: Individual exposure spectra.
In the MASTAR extension, the quality information is given in the MJDQUAL column. In the FITDETAIL extension, the quality information is given in the EXPQUAL column. In the header of the primary HDU of this FITS file, there is a keyword called "MSTRQUAL" that provides a summary quality information for this star. All of these follow the MASTAR_QUAL bitmask scheme. The MJDQUAL of a given visit spectrum is the AND product of the EXPQUAL of all of the exposures contributing to that visit. The MSTRQUAL is the OR product of all exposures taken for a given [PLATE]-[IFUDESIGN] combination.

