Image Gallery

This page shows images associated with the Sloan Digital Sky Survey. For more images, see our previous image galleries. To reuse these images, see Image Permissions.

SDSS and du Pont Telescopes

The SDSS telescope with its eight-petaled cover open
The SDSS telescope at Apache Point Observatory shown here in daylight. Most telescopes sit inside domes to protect them in bad weather. However the protective enclosure of the SDSS telescope is built on rollers so the building itself moves out of the way to allow the telescope to observe. Here the telescope sits on its observing platform without the protective enclosure covering it.

Image credit: SDSS
The SDSS telescope points towards a partially cloudy sky
The SDSS telescope observing the sky. This is reflecting telescope where light enters at the top, is focused by the primary mirror at the bottom end before bouncing off the secondary mirror and the top of the telescope and traveling through a hole in the primary mirror to the back of the telescope.

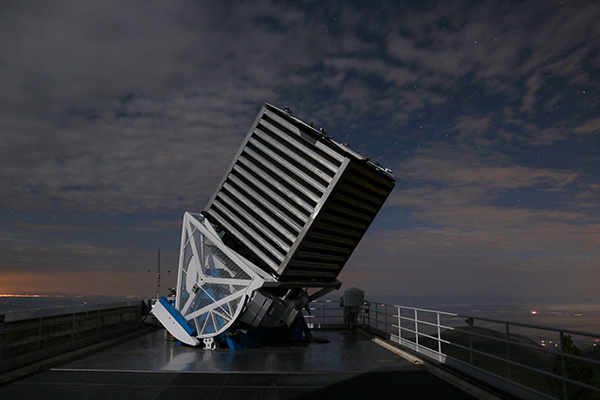
Image credit: SDSS/Patrick Gaulme
Below a starry sky, the SDSS telescope sits with its shutters closed. It is illuminated internally by a blue ligh
The SDSS telescope at Apache Point Observatory taking calibration observations. For these particular calibration observations, the telescope’s cover is closed and the inside of the telescope is illuminated by a special lamp.

Image credit: SDSS/David Law
The du Pont telescope points towards an opening in its dome during daylight
The du Pont telescope at Las Campanas observatory pointing out of its dome in daylight.

Image credit: SDSS/LCO

Focal Plane System

The video shows the fibers of the SDSS Focal Plane System (FPS) with red light shone in to the back end of each. Over the course of the video, the fiber positioning robots move the fibers from their regularly-spaced parking positions to positions they have been instructed to move the fibers to.

Video credit: SDSS/Rick Pogge

Download this video
Inside a circular housing sits a hexagonal array of regularly-spaced optical fibers with yellow caps on the end of each.
The SDSS Focal Plane System (FPS) in the lab prior to being fitted to the SDSS telescope at APO. Each of these yellow points a protective cap at the end of an optical fiber, a thin, transparent cable that transmits light from one end to the other. Each of these is moved by a robot to the position of as astronomical object in the focal plane of the telescope. The light from each object is then transmitted along the optical fiber to a spectrograph that measures the object’s spectrum.

Image credit: SDSS/Rick Pogge
A demonstration showing seven SDSS fiber-positioning robots move to their parking position and then move to new positions. Each SDSS focal plane unit (FPS) has 500 of these robots and for each observation each robot moves to the position of a particular target star, galaxy or quasar. Light from these objects then travels down the yellow fiber optic cable to a spectrograph that splits each object’s light up into its different colors.
Video credit: SDSS/Conor Sayres

Download this video

Local Volume Mapper

The roof of the enclosure of the Local Volume Mapper (LVM) rolls off to the side to reveal the four telescopes that undertake the observations.

Video credit: SDSS

Download this video
The shed-like enclosure of LVM with the roof rolled off. Inside are four small telescopes with black boxes next to them.

The four Local Volume Mapper (LVM) telescopes inside the open LVM enclosure at Las Campanas in Chile. The black boxes to the right of the telescopes are the optical benches that channel the light from the telescopes down bundles of optical fibers to spectrographs in the room under the roof on the right. Of these four telescopes, only one observes the target area of sky with two others observing calibration fields and another observing targets of known brightness for calibration.

Image credit: SDSS/Nick Konidaris
One of the small telescopes that form part of LVM pointing at a starry sky. Another small telescope in the array can be seen behind.
Two of the telescopes of the Local Volume Mapper with the roof of the enclosure open.

Image credit: SDSS/Maximilian Haaberle
Above the four telescopes of the LVM, the Milky Way appears vertical in the sky with the SMC appearing as a small bright blob to the left.
The four telescopes of Local Volume Mapper with the Milky Way and Small Magellanic Cloud (SMC) behind them. The telescopes are parked here and are not observing.

Image credit: SDSS/Yuri Beletzki
Knots and filaments of gas are interspersed with many roughly circular bubbles
This image is a mosaic of observations by the SDSS Local Volume Mapper (SDSS). This takes spectra of whole chunks of the sky looking for lines in the spectra caused by hot gas. The map here shows the gas in the Large Magellanic Cloud, a satellite galaxy of the Milky Way, which is drawn together by the gas’s own gravity into filaments and blasted apart by winds from hot stars. The filaments are the locations of dense clouds of gas where stars can form but the winds of particles sent out by those stars throw the gas away, suppressing the formation of more stars. Local Volume Mapper is trying to understand this process and how it shapes the formation of stars in the Milky Way, Large Magellanic Cloud and other nearby galaxies.

Each individual hexagon here represents one LVM observation

Image credit: SDSS/Héctor Ibarra
A hexagonal array of circular pixels map the Helix nebular with a round blue core and yellow to orange edge.
The Local Volume Mapper’s observation of the Helix Nebula. Each circle here represents a spectral pixel (also called a spaxel). For each of these Local Volume Mapper measures not just the intensity of light in that pixel, but a spectrum which is the intensity of light over a range of different colors. In a planetary nebula like the Helix Nebula, gas flung out from the dying star at the center of the nebula smashes in to the surrounding gas, forming shockwaves. These shockwaves cause the atoms and ions in the gas to emit at very specific colors of light. Here we’ve picked out three of these bright lines for the three colors in an RGB image. Sulfur ions for the red channel, hydrogen atoms for the green channel and oxygen atoms for the blue channel.

Image credit: SDSS/Aida Wofford

Milky Way Mapper

This visualization shows stars observed by the SDSS Milky Way Mapper (MWM) survey. Each dot is a star which had its spectrum observed by MWM and had its chemical composition determined from that spectrum. The distances of the stars and the representation of our Galaxy come from the European Space Agency’s Gaia mission.

The video starts from our perspective on Earth showing some regions of the sky observed by MWM and then zooms out to show our Galaxy from a distance. From this latter perspective the observations appear centered on one spot, the Earth’s position in the Milky Way. The color of the stars then changes to show the metal content (also known as metallicity) of the stars. Stars marked as yellow points have metal content similar to our Sun. Stars marked as blue points have spectra that have low metallic content relative to the sun. Stars marked as red points are rich in metal content relative to our Sun.

Video Credit: Szabolcs Mészáros, Vanda Lendvai for the SDSS Milky Way Mapper

Image credits:
https://www.cosmos.esa.int/web/gaia/gaiadr2_gaiaskyincolour
https://www.esa.int/ESA_Multimedia/Images/2025/01/The_best_Milky_Way_map_by_Gaia

Song: Stars In Her Skies
Composer: Scott Buckley
Website: https://youtube.com/user/musicbyscottb
License: Creative Commons (BY 4.0) https://creativecommons.org/licenses/by/4.0/
Music powered by BreakingCopyright: https://breakingcopyright.com
This still image from the previous video shows a representation of our Galaxy viewed from the side or edge-on. Viewed like this the disk of our Galaxy appears as a thin line.

Stars observed by Milky Way Mapper are marked as colored point. These stars had their spectra observed by Milky Way Mapper and from those spectra SDSS astronomers determined the chemical composition of each of these stars. The color of each star represents the metal content (also known as metallicity) of each star. Stars marked as yellow have a metal content similar to the Sun. Stars marked as blue points have spectra that have low metallic content relative to the sun. Stars marked as red points are rich in metal content relative to our Sun.

You can see here that the further away you go from the plane (the middle line) of the Galactic disk, the fewer metals a typical star has. This is because these stars are older. They formed from gas with a lower metal content. As time has gone on, successive generations have stars have enriched the gas that forms the fuel for star formation. This means younger stars (which lie closer to the plane) have a higher metal content.

Image Credit: Szabolcs Mészáros, Vanda Lendvai for the SDSS Milky Way Mapper

Galaxy image credits:
https://www.cosmos.esa.int/web/gaia/gaiadr2_gaiaskyincolour
https://www.esa.int/ESA_Multimedia/Images/2025/01/The_best_Milky_Way_map_by_Gaia

Other SDSS Image Galleries

Many more images can be found on the Image Galleries of previous generations of the Sloan Digital Sky Survey:

Image Permissions

We provide all images on a Creative Commons Attribution license (CC-BY). Any SDSS image on the SDSS Web site may be downloaded, linked to, or otherwise used for any purpose, provided that you maintain the image credits. Unless otherwise stated, images should be credited to the Sloan Digital Sky Survey.

We note that:

  • Your use of the image does not imply our endorsement of any product or service
  • If the image is to be used on a Web page, we also ask as a courtesy that you provide a link back to our site at www.sdss.org
  • All SDSS data released in our public data releases is considered in the public domain

Any questions about image use should be directed to the Astrophysical Research Consortium’s business office via ARC’s business manager as follows:

Alim Patten
ARC Business Manager
c/o Department of Astronomy, Box 351580
University of Washington
Seattle, WA 98195
Phone: +1-206-616-0035
Email: alimyp@uw.edu

Back to Top