MaStar Tutorials
Python Tutorial
Using the mastarall file
First, import the necessary packages:
import astropy.io.fits as fits
import numpy as np
import matplotlib.pyplot as plt
The mastarall file contains important summary info about each star in the catalog. We can load in the catalog with
mastarall = fits.open(dir + 'mastarall-v3_1_1-v1_7_7.fits')
where “dir” is the path to the directory where you’ve stored the mastarall file.
To look at the header information of the fits file and identify which extension to use, type
mastarall.info()
We are interested in the "GOODVISITS" extension, so we will be using extension 2. For a full description of the different extensions, see the catalog documentation.
To learn what information this extension contains, list all of the column names using:
mastarall[2].data.names
To import your stellar parameter file of choice, go to this link. For this example we will be using the median parameter set corresponding to the MaStar "goodvisits" set of stellar spectra. We load in the parameters with
params = fits.open(dir + 'mastar-goodvisits-v3_1_1-v1_7_7-params-v1.fits')[1].data
teff, logg, feh = params['TEFF_MED'], params['LOGG_MED'], params['FEH_MED']
ngroups = params['NGROUPS']   #used to remove stars without valid parameter entries.
The "NGROUPS" column is used here to remove entries without valid median parameters assigned to them (ngroups = 0 indicates that the entry is invalid). Let’s select all K stars from this catalog with effective temperatures between 3700 and 5200K and print the number of stars found:
ksel = np.where((teff > 3700) & (teff < 5200) & (ngroups != 0))[0]
print(len(mastarall[2].data[ksel]))   #how many spectra are selected
We can use this selector to examine other properties of these stars, such as their surface gravity distribution, e.g.,
plt.hist(logg[ksel])
plt.title("log g")
plt.show()
Or alternatively you can put the K stars into their own structure including all parameters from the mastarall structure.
kstars = fits.open(dir + 'mastar-goodvisits-v3_1_1-v1_7_7-params-v1.fits')[1].data[ksel]
plt.hist(kstars["LOGG_MED"])
plt.title("log g")
plt.show()
Plotting a MaStar spectrum
Let’s plot the spectrum for the first of our K stars selected above. We first need to find its MaNGA ID:
print(kstars[0]["MANGAID"])
Next we will load in the spectra file described here:
goodspec = fits.open(dir+'mastar-goodspec-v3_1_1-v1_7_7.fits')[1].data
Cross-reference the MaNGA ID from the mastarall file with the goodspec file to isolate the spectra we're interested in. Note that most stars are observed multiple times, so this may return more than one spectra:
visits = (goodspec["MANGAID"] == kstars[0]["MANGAID"])
wl = goodspec[visits]["WAVE"][0]
flux = goodspec[visits]["FLUX"][0]
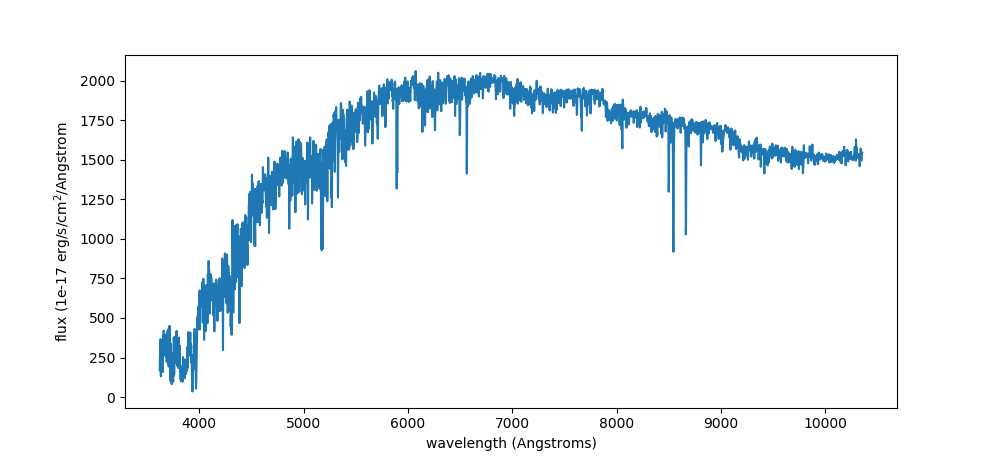
Now let’s plot the spectrum. Note that this has NOT been de-reddened and that E(B-V) values can be found here (based on Gaia DR2 and 3D dust map) or here (based on Gaia EDR3 and 3D dust map):
plt.plot(wl,flux)
plt.ylabel("flux (1e-17 erg/s/cm$^2$/Angstrom")
plt.xlabel("wavelength (Angstroms)")
plt.show()
Plotting a Gaia Colour Magnitude Diagram (CMD)
We can use the extinction corrected Gaia colours in this file to plot a CMD of MaStar stars.
Firstly, download the file and open it to get the Gaia colour index and absolute magnitude.
photom = fits.open(dir + 'mastarall-gaiaedr3-extcorr-simbad-ps1-v3_1_1-v1_7_7-v1.fits')[1].data
bprp_gaia, g_mag = photom['BPRPC'], photom['M_G']   #photometry
clean_match = photom['GAIA_CLEANMATCH']          #mask of those entries with a clean match in Gaia
mask = np.where((bprp_gaia > -999)&(clean_match == 1))   #mask of the valid colors and Gaia
Now plot the CMD:
plt.plot(bprp_gaia[mask], g_mag[mask], 'k.')
plt.gca().invert_yaxis()
plt.xlabel('G_BP-G_RP')
plt.ylabel('M_G')
plt.show()
IDL Tutorial
Using the mastarall file
The mastarall file contains important summary info about each star in the catalog. We can load in the catalog with
mastar = mrdfits(dir + 'mastarall-v3_1_1-v1_7_7.fits','GOODSTARS',hdr)
where "dir" is the path to the directory where you've stored the mastarall file. Here, we have read in the GOODSTARS extension. For a full description of the different extensions, see the catalog documentation.
To see the contents of the catalog, type
help,mastar,/str
To download the stellar parameter file of choice, see this page. For this example we will be using the median parameter set corresponding to the MaStar "goodstars" set of stellar spectra. We load in the parameters with
params=mrdfits(dir+'mastar-goodstars-v3_1_1-v1_7_7-params-v1.fits',1)
We need to use the "NGROUPS" column in this structure array to remove entries without valid median parameters assigned to them (ngroups = 0 indicates that the entry is invalid). Let's select all K stars from this catalog with effective temperatures between 3700 and 5200 K, and print the number of stars found:
ksel = where(params.teff_med ge 3700 and params.teff_med lt 5200 and params.ngroups ge 1,count)
print,count
We can use this selector to examine other properties of these stars, such as their surface gravity distribution, e.g.,
plothist,params[ksel].logg_med, xr=[-1,10],xtitle='log g'
Or alternatively you can put the K stars into their own IDL structure including all parameters from the mastar structure.
kstars = params[ksel]
plothist,kstars.logg_med,xtitle='log g', xr=[-1,10]
Plotting a MaStar spectrum
Let's plot the spectrum for the first of our K stars selected above. We first need to find its MaNGA ID:
print,kstars[0].mangaid
Next we will load in the spectra file described here:
goodspec = mrdfits(dir+"mastar-goodspec-v3_1_1-v1_7_7.fits.gz",1,hdr2)
Cross-reference the MaNGA ID from the mastarall file with the goodspec file to isolate the spectra we're interested in. In this case, the star was observed multiple times, so we will plot the first visit:
visits = where(strtrim(goodspec.MANGAID,2) eq strtrim(kstars[0].MANGAID,2))
wl = goodspec[visits[0]].WAVE
flux = goodspec[visits[0]].FLUX
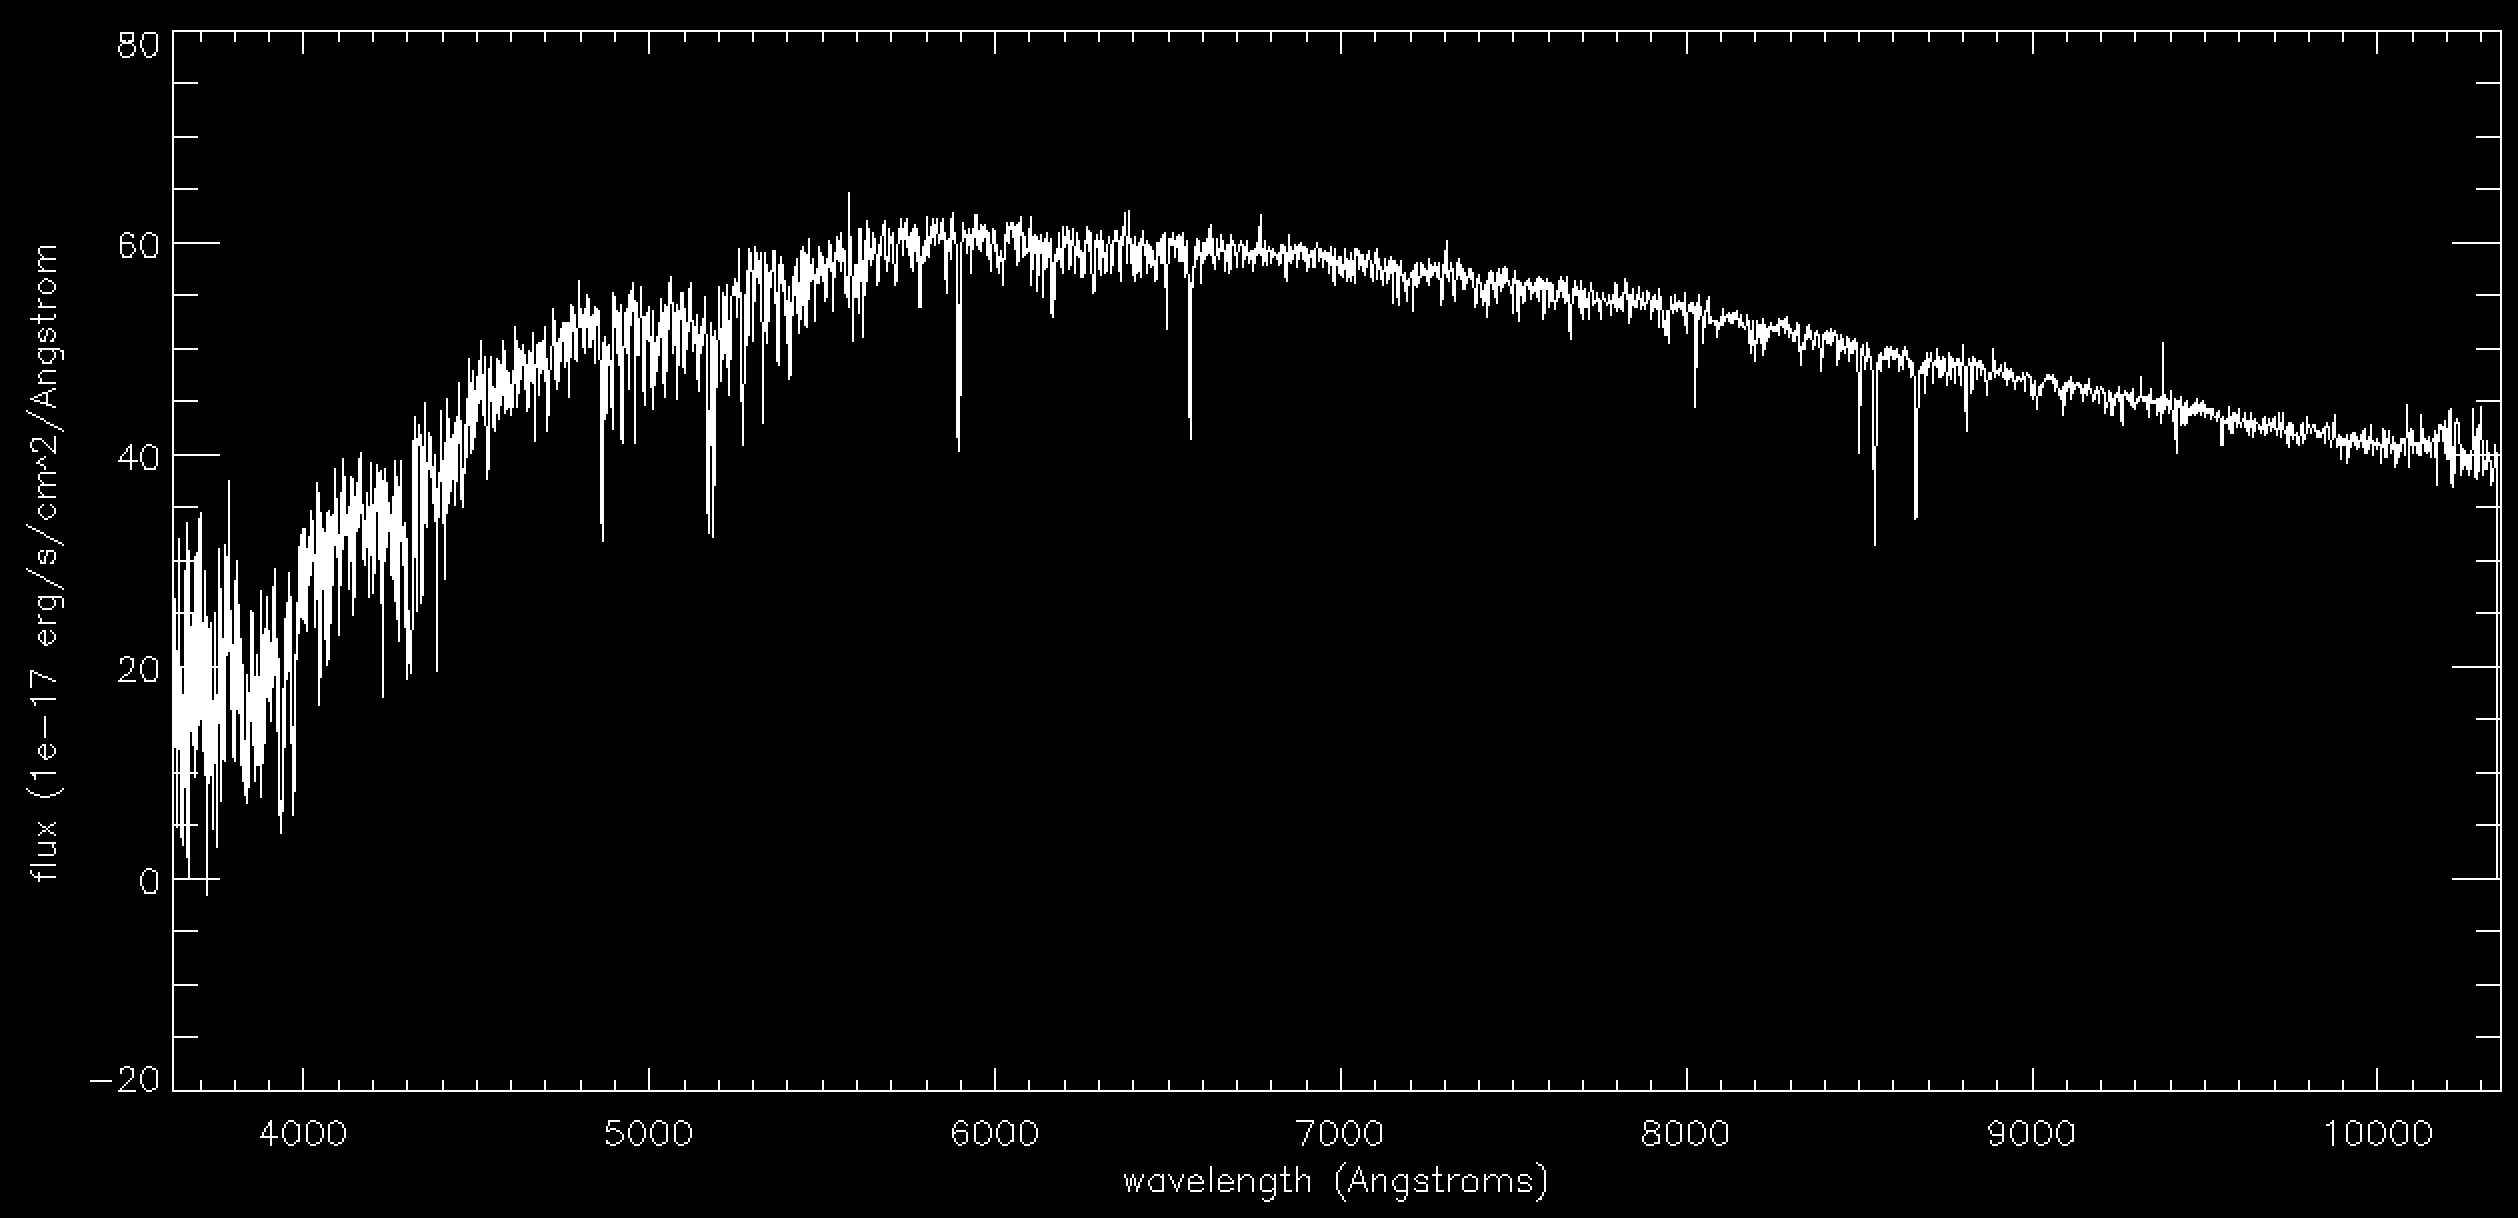
Now let's plot the spectrum:
plot,wl,flux,xtitle='wavelength (Angstroms)',ytitle='flux (1e-17 erg/s/cm^2/Angstrom',xst=1