Summary
APOGEE Stellar Parameter and Chemical Abundances Pipeline (ASPCAP) is a pipeline for measuring stellar parameters and chemical abundances from APOGEE spectra.
ASPCAP wraps the FERRE code (Allende Prieto et al. 2006), which interpolates spectra from a (potentially high dimensional) rectilinear grid and minimizes the χ2 statistic. FERRE includes options to simultaneously fit the continuum, allows for different degrees (and methods) of interpolation, among other features.
FERRE is a FORTRAN code to interpolate rectilinear grids of spectra and find the best stellar parameters by minimizing the χ2 statistic. There are numerous options in FERRE to allow for simultaneous fits of the continuum, handling line spread functions, freezing particular parameters, and other options.Outputs from FERRE are not explicitly included as part of Data Release 19 because FERRE is only executed as a component of the ASPCAP pipeline. A single row in an ASPCAP table might be constructed from about ~25 FERRE executions (~20 abundance executions, one stellar parameter execution, and a few executions during the initial stage). For these reasons, although FERRE exists as a pipeline that is integrated in Astra, there are no output data products in Data Release 19 that come directly from FERRE.
García Pérez et al. 2016 provides the overall description of ASPCAP. Variations of ASPCAP have been used for previous SDSS Data Releases (DR 10, Mészáros et al. (2013); DR12, García Pérez et al. (2016); DR13 and DR14, Holtzman et al. (2018); DR16, Jönsson et al. (2020); and DR17, Holtzman et al, in prep). In Data Release 19 the FERRE spectral libraries used are the same as those used for Data Release 17. Spectral grids have been constructed using the Synspec (e.g., Hubeny et al. 2021) spectral synthesis code that incorporate NLTE level populations for Na, Mg, K, and Ca (Osorio et al. 2020). The syntheses use model atmospheres computed by the MARCS group for FGKM stars, as described in Holtzman et al. (2018) and DR16 modifications are detailed in Jönsson et al. (2020). Kurucz model atmospheres for hot stars. The atomic and line list data used for synthesizing the spectra is described in Smith et al. (2021). For the hot star OBA grid, Kurucz stellar atmospheres were used (Mészáros et al. 2012); these can be found at https://data.sdss.org/sas/dr17/apogee/spectro/speclib/atmos/kurucz/
Spectral synthesis failed for some sets of stellar parameters, typically due to a failure to converge towards a solution for the chemical equilibrium. In these cases radial basis function interpolation was used to interpolate a high-resolution spectrum. With a complete rectilinear grid of high-resolution spectra, various convolutions were applied to account for the fiber-dependent line spread function in the two APOGEE instruments. Specifically, for each high-resolution spectrum with a temperature less than 8000 K, these spectra were convolved with eight different line spread kernels (four for APOGEE at Apache Point Observatory, and four for APOGEE at Las Campanas Observatory). The determination about which convolved grid is used to analyze a given spectrum depends on the observatory, and the fiber number (or mean fiber number if the spectrum is a coadd of individual visits).
The complete synthetic spectral library is prohibitively large for practical use. This remains true even after compressing the spectral library using PCA. The PCA-compressed spectral library would barely fit in memory on the compute nodes available to the Survey, and far exceeded the memory capacity for the compute nodes available for most of SDSS-IV, which is when these grids were generated. For these reasons, the synthetic grids are segregated into smaller grids, with edges drawn based on spectral type and the photospheres used, ensuring some overlap between the grids. The grid ultimately used for analysis is stored in the ASPCAP output files, and might broadly be described as M-giant, M-dwarf, F-giant, F-dwarf, GK-giant, GK-dwarf, and BA-type (where no distinction is made based on surface gravity). With the exception of the BA-type grid, all other grids are convolved with the eight line spread functions described earlier. For the BA-type grid, these are convolved using a standard spectral resolution of R ~ 22,500.
The dimensions of each grid vary. All grids have dimensions of effective temperature, surface gravity, metallicity, alpha-enhancement, and microturbulence (parameterized as `log10_v_micro`). Main-sequence grids include rotational broadening (parameterized as `log10_v_sini`), but giant grids do not.
Detailed Description
ASPCAP has three distinct stages that are completed in serial:
- In the coarse stage we fix certain parameters just to get a reliable coarse estimate of the stellar parameters, and to select which synthetic grid to use in subsequent stages.
- In the stellar parameters stage we allow all parameters to vary and initialize from the best coarse step estimate.
- In the abundances stage we fix the stellar parameters to the values found during the stellar parameter stage, and adjust one or more abundance dimensions with carefully-derived masks around specific lines.
Some special pre-processing steps are taken before FERRE is executed. These steps are to handle imperfect sky subtraction from the APOGEE data reduction pipeline as evidenced by pixels that are formally very precise, but are clearly residual sky lines. For example, sky lines that are visible to the human eye, but those pixels have extremely low errors on flux values and are not flagged as being affected by sky subtraction. These pixels are formally highly precise, yet inaccurate (biased), and can have a deleterious effect on the optimization process. First we inflate the errors (by a factor of 100) for pixels that are flagged by the data reduction pipeline as being significantly affected by skylines. Next we compute the median flux, and the standard deviation of the flux. We then compute the number of standard deviations each flux value is (relative to this median and standard deviation). Spikes in the spectrum are defined by any deviations exceeding 3\sigma, and we set the error values for these pixels to be 1e10.
We then define so-called bad pixels as any that have: non-finite values of flux; non-finite values of flux errors; negative values of flux; negative values of flux errors; or are flagged by the pipeline as having any so-called ‘bad’ level value (bit value 16639). Pixels meeting any of these criteria are set to have flux errors of 1e10. Lastly, we clip the flux errors such that the minimum flux error value is 0.05.
The Coarse Stage
The purpose of the coarse stage is to get a reasonable estimate of effective temperature, surface gravity, and metallicity, and to decide which spectral grid should be used to analyze this spectrum.
The coarse stage starts by taking an estimate of the stellar parameters as reported by the APOGEENet (v2) pipeline. This differs from Data Release 17, where the DOPPLER stellar parameters were used as an initial guess for ASPCAP. With this estimate of the stellar parameters, we compute an initial guess for microturbulence based on the following relation:
xi = 0.372160 -0.090531 * logg – 0.000802 * logg2 + 0.001263 * logg3
The remaining parameters are given the following initial values:
- `alpha_m`: 0
- `log10_v_sini`: 1.0
- `c_m`: 0
- `n_m: 0
Depending on the grid, some of these parameters are frozen to these initial values. For example, in the coarse stage we freeze `c_m` at 0 and `n_m` at 0 for all grids. And for the F-type main-sequence grid, we freeze `alpha_m` at 0.
We find the set of all spectral grids that have boundaries such that the APOGEENet estimate is within the bounds of the grid. We further sub-select this set of spectral grids based on the telescope used, and the fiber number determines which of the four convolved grids (for that telescope) should be used. The LSF models used are labelled ‘a’, ‘b’, ‘c’, ‘d’, based on the following fiber blocks:
- a: for fiber numbers within (245, 300]
- b: for fiber numbers within [245, 145)
- c: for fiber numbers within [145, 50)
- d: for fiber numbers between [50, 1]
If the spectrum is a coadd from many visits (taken with different fiber numbers) then we take the mean fiber number (weighted by the (S/N)^2 of individual visits).
If the stellar parameter estimate from APOGEENet falls within the overlap region between spectral grids, then in the coarse stage FERRE will be executed once in each of those grids. If the APOGEENet stellar parameters fall outside the bounds of all grids, then the closest grid will be used for initialization, and the initial stellar parameters will be clipped to the boundaries of the grid. Naturally, this only occurs for very hot or cold stars where APOGEENet predicts an effective temperature outside the range of the FERRE grids, or the estimated surface gravity from APOGEENet is slightly outside the range of FERRE grids.
The continuum is fit simultaneously by FERRE during the coarse stage. A fourth-order polynomial is used to model the continuum in each chip, but as we describe later, this does not fully describe how the continuum is handled. We interpolate grids using cubic spline interpolation. A global mask is used to mask some problematic pixels, but this represents only a few percent of pixels.
If a spectrum is analyzed multiple times with FERRE in the initial stage, from different spectral grids, then ASPCAP waits until all those executions are complete. Then there is a process of determining which of the coarse stage FERRE results is the best. This is determined by taking the lowest so-called penalized χ2 value, which is different from the raw χ2 value that is reported from FERRE. There are numerous steps why we penalize a χ2 value, which are taken as empirical steps to try and improve the final results. Those penalization steps are:
- If the effective temperature from FERRE is less than 3900 K for the GK-type grid, then multiply the χ2 value by 10.
- If the surface gravity is within one grid point from the edge of the grid, multiply the χ2 value by 5.
- If the effective temperature is within one grid point from the edge of the grid, multiply the χ2 value by 5.
- If the surface gravity is within 1/8th of a grid point from the edge of the grid, multiply the χ2 value by 10.
- If the effective temperature is within 1/8th of a grid point from the edge of the grid, multiply the χ2 value by 10.
After applying all penalization rules to the χ2 value from each execution, the result with the lowest penalized χ2 value is taken as the best result for that spectrum from the coarse stage. These stellar parameters found during the coarse stage are taken as the initial value for the stellar parameter stage.
The Stellar Parameter Stage
The purpose of the stellar parameter stage is to simultaneously fit all stellar parameters. With the most appropriate spectral grid selected from the coarse stage, this is used for the stellar parameter and abundances stage.
An important step is taken to handle the continuum before the stellar parameter stage starts. We compute a moving median of the ratio of the flux relative to the best-fit model flux from the initial stage. We clip outliers and interpolate over bad pixels before computing that moving median (e.g., ratio values outside of 0.1 and 10), and we use a bandpass of 151 pixels to compute the median ratio. The moving median is then applied as a continuum correction to the data. This median filtering step provides a flexible correction to account for model-data mis-match, and is an important step for estimating reliable stellar parameters from APOGEE spectra with FERRE. However, the continuum is still estimated simultaneously by FERRE during the stellar parameter stage, where again we use a fourth-order polynomial per chip. No parameter dimensions are fixed during the stellar parameter stage. The same global pixel mask used in the initial stage is used in the stellar parameters stage, but this mask only excludes a small percentage of pixels.
The Abundances Stage
In the abundances stage we estimate detailed chemical abundances by executing FERRE where we keep the stellar parameters fixed and only allow an abundance dimension to vary, and often where we mask pixels except for narrow regions around atomic absorption lines.
The masks used are different for every element. For some elements that contribute absorption across many wavelengths (e.g., C, N), these are close to full spectrum fits where the stellar parameters are fixed but the abundance dimension can vary. For other elements that only have a few clean unblended atomic lines, the mask used excludes most of the spectrum.
One important difference about ASPCAP in Data Release 19 compared to Data Release 17 is how the continuum is treated during the abundances stage. In Data Release 17 the continuum was fit simultaneously with each element abundance. That meant there was potentially a different best-fit continuum for every element abundance. In Data Release 19 we fix the continuum to the best-fit continuum found during the stellar parameter stage, and do not allow the continuum to vary during the abundance stage.
Another difference relates to the data products. In Data Release 17 only the best-fitting model spectrum from the stellar parameter stage was available to the end user. The best-fitting model spectra found during the abundances stage was not available. In Data Release 19 these best-fitting model spectra are stored for every elemental abundance (and the stellar parameter stage). They are named appropriately (e.g., `model_flux`, `model_flux_al_h`, et cetera). Because the continuum is fixed during the element abundance stage, only one array is necessary to store the best-fit continuum (named `continuum`).
The dimension that is allowed to vary during the abundances stage is usually the metallicity dimension. However, for alpha-process elements medianthe `alpha_m` dimension is varied, and for carbon and nitrogen we vary the `c_m` and `n_m` dimensions, respectively. This process means that some elements are measured relative to hydrogen, andmedian some are measured relative to overall metallicity. For convenience the ASPCAP products in Data Release 19 all report element abundances relative to hydrogen, except for the `alpha_m_atm` abundance ratio which is a global alpha-element enhancement. The `_m_atm` suffix is new for Data Release 19 and is named to try and differentiate measurements that were made from a global fit with FERRE (e.g., `m_h_atm`, `c_m_atm`, `n_m_atm`, `alpha_m_atm`), and those that were measured using bespoke grids and are conditioned on fixed stellar parameters (e.g., `fe_h`, `c_h`, `n_h`, `mg_h`). For element abundances that were measured using the `alpha_m_atm` dimension but are reported relative to hydrogen, we add the errors of each measurement in quadrature such that the error on the `x_h` abundance more closely reflects our knowledge of the true error.
At the end of the abundance stage, the results from all FERRE executions are aggregated together and stored in an ASPCAP table in the Astra database, and ultimately exported to ASPCAP output data products. Results from individual FERRE executions remain available in Astra for the collaboration and debugging purposes, but are considered intermediate products and not made easily accessible.
Post-Processing Steps
All versions of ASPCAP have included post-processing steps to adjust, or make corrections to, the raw values that are reported by FERRE. Some of these post-processing steps have been to remove obviously incorrect measurements in a problematic area of parameter space, whereas some of these post-processing steps are to apply corrections to the individual values.
In both scenarios (omitted or calibrated values), the raw values from FERRE are still available in the ASPCAP table. These values are denoted with the `raw_` prefix to differentiate them from the calibrated values (e.g., `raw_teff` compared to `teff`), which are what we recommend for use for most scientific inquiries.
Please see Casey et al (in prep) for a complete description of the post-processing steps.
Effective temperature
The ASPCAP effective temperatures in Data Release 19 have been calibrated to be statistically consistent with effective temperatures estimated by the infrared flux method.
The approach can be briefly described as computing effective temperatures from photometry and existing colour-temperature relations, then constructing a mapping from the raw (spectroscopic) FERRE effective temperature to those computed from photometry. Two existing colour relations are used for effective temperatures: one for main-sequence stars and one for giant stars. We used the V-K colour relations from Gonzalez-Hernandez et al., where the K-band magnitudes are taken from 2MASS and for the V-band we use synthetic magnitudes computed from Gaia XP spectra. These relations require an input (V-K) magnitude and a metallicity to compute an effective temperature.
Surface gravity
The surface gravities of ASPCAP are calibrated to be statistically consistent with gravities from asteroseismology.
Chemical abundances
The chemical abundances for most elements have had their zeropoint adjusted so that the cool solar-metallicity stars in the solar neighborhood have [X/Fe]=0. See Mészáros et al. (2025) for more details.
Data Products
ASPCAP produces two key data products. The `astraAllStarASPCAP` file summarises all the ASPCAP results, but does not include any model flux arrays. In addition to the summary file, there are many `astraStarASPCAP` files that include the ASPCAP results for a given `sdss_id`, the best-fit model fluxes, and best-fit continuum arrays. The `astraStarASPCAP` is the closest analogue to the `aspcapStar` files in SDSS-IV Data Release 17. However, unlike Data Release 17, the `astraStarASPCAP` files contain the best-fit model flux arrays from the stellar parameter stage and all the chemical abundance fits. As a consequence, the `astraStarASPCAP` files will contain about 20 arrays of best-fit model fluxes. These are appropriately named in that the best-fit model spectra at the element abundances stage are named `model_flux_<abundance_ratio>` (e.g., `model_flux_al_h`). The `model_flux` represents the best-fit model spectrum at the stellar parameter stage, and the `continuum` array is the best-fit continuum at the stellar parameter stage, which remains fixed for the element abundances stage.
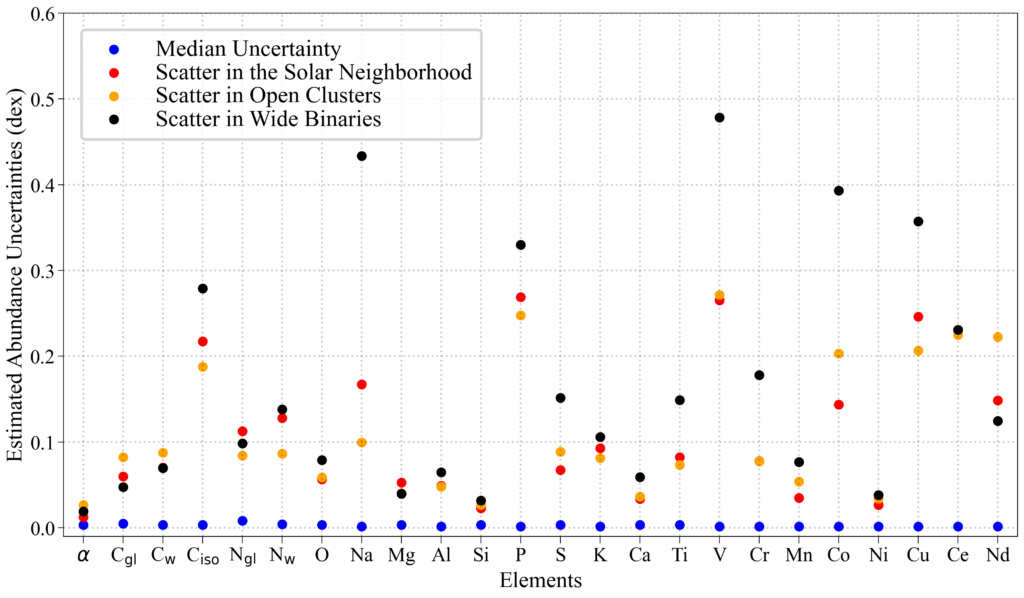
Validation and Uncertainties
In addition to the uncertainties estimated from repeat observations, we estimate uncertainties by comparison with external values.
Cool Stars: Mészáros et al. (2025) compared DR19 ASPCAP values for stars with Teff < 8000K with an extensive set of validation data, including IRFM temperatures, seismic log g’s, and metallicities and elemental abundances with other surveys. Below we show one plot from the paper, but please read the paper for a full discussion of uncertainties in stellar parameters and abundances.
Hot Stars: The hot star synthetic spectral grid is only in 4-dimensions: Teff, log g, [M/H], and log vrot. Therefore, there are no element abundance ratios for Teff > 8000K. Please see the Using Stellar Parameters for a brief discussion of temperature validation for ASPCAP hot stars.
Flags
| Field Name | Bit | Flag Name | Flag Description |
irfm_teff_flags | 0 | OUT_OF_V_K_BOUNDS | Out of V-Ks bounds |
irfm_teff_flags | 1 | OUT_OF_FE_H_BOUNDS | Out of [Fe/H] bounds |
irfm_teff_flags | 2 | EXTRAPOLATED_V_MAG | Synthetic V magnitude is extrapolated |
irfm_teff_flags | 3 | POOR_QUALITY_K_MAG | Poor quality Ks magnitude |
irfm_teff_flags | 4 | EBV_USED_IS_UPPER_LIMIT | E(B-V) used is an upper limit |
irfm_teff_flags | 5 | AS_DWARF_FOR_IRFM_TEFF | Flagged as dwarf for IRFM temperature |
irfm_teff_flags | 6 | AS_GIANT_FOR_IRFM_TEFF | Flagged as giant for IRFM temperature |
al_h_flags | 5 | AL_H_CENSORED_HIGH_TEFF | Censored value because abundances known to be wrong for this Teff |
al_h_flags | 6 | AL_H_CENSORED_LOW_TEFF_VMICRO | Censored value because it has low Teff and v_micro |
al_h_flags | 7 | AL_H_CENSORED_UNPHYSICAL | Censored value because FERRE returned unphysical value |
al_h_flags | 8 | AL_H_BAD_GRID_EDGE | Grid edge bad |
al_h_flags | 9 | AL_H_WARN_GRID_EDGE | Grid edge warning |
al_h_flags | 10 | AL_H_WARN_TEFF | These abundances are known to be unreliable for this Teff |
al_h_flags | 11 | AL_H_WARN_M_H | These abundances are known to be unreliable for this [M/H] |
c_12_13_flags | 5 | C_12_13_CENSORED_HIGH_TEFF | Censored value because abundances known to be wrong for this Teff |
c_12_13_flags | 6 | C_12_13_CENSORED_LOW_TEFF_VMICRO | Censored value because it has low Teff and v_micro |
c_12_13_flags | 7 | C_12_13_CENSORED_UNPHYSICAL | Censored value because FERRE returned unphysical value |
c_12_13_flags | 8 | C_12_13_BAD_GRID_EDGE | Grid edge bad |
c_12_13_flags | 9 | C_12_13_WARN_GRID_EDGE | Grid edge warning |
c_12_13_flags | 10 | C_12_13_WARN_TEFF | These abundances are known to be unreliable for this Teff |
c_12_13_flags | 11 | C_12_13_WARN_M_H | These abundances are known to be unreliable for this [M/H] |
ca_h_flags | 5 | CA_H_CENSORED_HIGH_TEFF | Censored value because abundances known to be wrong for this Teff |
ca_h_flags | 6 | CA_H_CENSORED_LOW_TEFF_VMICRO | Censored value because it has low Teff and v_micro |
ca_h_flags | 7 | CA_H_CENSORED_UNPHYSICAL | Censored value because FERRE returned unphysical value |
ca_h_flags | 8 | CA_H_BAD_GRID_EDGE | Grid edge bad |
ca_h_flags | 9 | CA_H_WARN_GRID_EDGE | Grid edge warning |
ca_h_flags | 10 | CA_H_WARN_TEFF | These abundances are known to be unreliable for this Teff |
ca_h_flags | 11 | CA_H_WARN_M_H | These abundances are known to be unreliable for this [M/H] |
ce_h_flags | 0 | CE_H_UPPER_LIMIT_T1 | At least one line is an upper limit by the 1% threshold in Hayes et al. (2022, ApJ, 262, 34) |
ce_h_flags | 1 | CE_H_UPPER_LIMIT_T2 | At least one line is an upper limit by the 2% threshold in Hayes et al. (2022, ApJ, 262, 34) |
ce_h_flags | 2 | CE_H_UPPER_LIMIT_T3 | At least one line is an upper limit by the 3% threshold in Hayes et al. (2022, ApJ, 262, 34) |
ce_h_flags | 3 | CE_H_UPPER_LIMIT_T4 | At least one line is an upper limit by the 4% threshold in Hayes et al. (2022, ApJ, 262, 34) |
ce_h_flags | 4 | CE_H_UPPER_LIMIT_T5 | At least one line is an upper limit by the 5% threshold in Hayes et al. (2022, ApJ, 262, 34) |
ce_h_flags | 5 | CE_H_CENSORED_HIGH_TEFF | Censored value because abundances known to be wrong for this Teff |
ce_h_flags | 6 | CE_H_CENSORED_LOW_TEFF_VMICRO | Censored value because it has low Teff and v_micro |
ce_h_flags | 7 | CE_H_CENSORED_UNPHYSICAL | Censored value because FERRE returned unphysical value |
ce_h_flags | 8 | CE_H_BAD_GRID_EDGE | Grid edge bad |
ce_h_flags | 9 | CE_H_WARN_GRID_EDGE | Grid edge warning |
ce_h_flags | 10 | CE_H_WARN_TEFF | These abundances are known to be unreliable for this Teff |
ce_h_flags | 11 | CE_H_WARN_M_H | These abundances are known to be unreliable for this [M/H] |
c_1_h_flags | 0 | C_1_H_UPPER_LIMIT_T1 | At least one line is an upper limit by the 1% threshold in Hayes et al. (2022, ApJ, 262, 34) |
c_1_h_flags | 1 | C_1_H_UPPER_LIMIT_T2 | At least one line is an upper limit by the 2% threshold in Hayes et al. (2022, ApJ, 262, 34) |
c_1_h_flags | 2 | C_1_H_UPPER_LIMIT_T3 | At least one line is an upper limit by the 3% threshold in Hayes et al. (2022, ApJ, 262, 34) |
c_1_h_flags | 3 | C_1_H_UPPER_LIMIT_T4 | At least one line is an upper limit by the 4% threshold in Hayes et al. (2022, ApJ, 262, 34) |
c_1_h_flags | 4 | C_1_H_UPPER_LIMIT_T5 | At least one line is an upper limit by the 5% threshold in Hayes et al. (2022, ApJ, 262, 34) |
c_1_h_flags | 5 | C_1_H_CENSORED_HIGH_TEFF | Censored value because abundances known to be wrong for this Teff |
c_1_h_flags | 6 | C_1_H_CENSORED_LOW_TEFF_VMICRO | Censored value because it has low Teff and v_micro |
c_1_h_flags | 7 | C_1_H_CENSORED_UNPHYSICAL | Censored value because FERRE returned unphysical value |
c_1_h_flags | 8 | C_1_H_BAD_GRID_EDGE | Grid edge bad |
c_1_h_flags | 9 | C_1_H_WARN_GRID_EDGE | Grid edge warning |
c_1_h_flags | 10 | C_1_H_WARN_TEFF | These abundances are known to be unreliable for this Teff |
c_1_h_flags | 11 | C_1_H_WARN_M_H | These abundances are known to be unreliable for this [M/H] |
c_h_flags | 0 | C_H_UPPER_LIMIT_T1 | At least one line is an upper limit by the 1% threshold in Hayes et al. (2022, ApJ, 262, 34) |
c_h_flags | 1 | C_H_UPPER_LIMIT_T2 | At least one line is an upper limit by the 2% threshold in Hayes et al. (2022, ApJ, 262, 34) |
c_h_flags | 2 | C_H_UPPER_LIMIT_T3 | At least one line is an upper limit by the 3% threshold in Hayes et al. (2022, ApJ, 262, 34) |
c_h_flags | 3 | C_H_UPPER_LIMIT_T4 | At least one line is an upper limit by the 4% threshold in Hayes et al. (2022, ApJ, 262, 34) |
c_h_flags | 4 | C_H_UPPER_LIMIT_T5 | At least one line is an upper limit by the 5% threshold in Hayes et al. (2022, ApJ, 262, 34) |
c_h_flags | 5 | C_H_CENSORED_HIGH_TEFF | Censored value because abundances known to be wrong for this Teff |
c_h_flags | 6 | C_H_CENSORED_LOW_TEFF_VMICRO | Censored value because it has low Teff and v_micro |
c_h_flags | 7 | C_H_CENSORED_UNPHYSICAL | Censored value because FERRE returned unphysical value |
c_h_flags | 8 | C_H_BAD_GRID_EDGE | Grid edge bad |
c_h_flags | 9 | C_H_WARN_GRID_EDGE | Grid edge warning |
c_h_flags | 10 | C_H_WARN_TEFF | These abundances are known to be unreliable for this Teff |
c_h_flags | 11 | C_H_WARN_M_H | These abundances are known to be unreliable for this [M/H] |
co_h_flags | 5 | CO_H_CENSORED_HIGH_TEFF | Censored value because abundances known to be wrong for this Teff |
co_h_flags | 6 | CO_H_CENSORED_LOW_TEFF_VMICRO | Censored value because it has low Teff and v_micro |
co_h_flags | 7 | CO_H_CENSORED_UNPHYSICAL | Censored value because FERRE returned unphysical value |
co_h_flags | 8 | CO_H_BAD_GRID_EDGE | Grid edge bad |
co_h_flags | 9 | CO_H_WARN_GRID_EDGE | Grid edge warning |
co_h_flags | 10 | CO_H_WARN_TEFF | These abundances are known to be unreliable for this Teff |
co_h_flags | 11 | CO_H_WARN_M_H | These abundances are known to be unreliable for this [M/H] |
cr_h_flags | 5 | CR_H_CENSORED_HIGH_TEFF | Censored value because abundances known to be wrong for this Teff |
cr_h_flags | 6 | CR_H_CENSORED_LOW_TEFF_VMICRO | Censored value because it has low Teff and v_micro |
cr_h_flags | 7 | CR_H_CENSORED_UNPHYSICAL | Censored value because FERRE returned unphysical value |
cr_h_flags | 8 | CR_H_BAD_GRID_EDGE | Grid edge bad |
cr_h_flags | 9 | CR_H_WARN_GRID_EDGE | Grid edge warning |
cr_h_flags | 10 | CR_H_WARN_TEFF | These abundances are known to be unreliable for this Teff |
cr_h_flags | 11 | CR_H_WARN_M_H | These abundances are known to be unreliable for this [M/H] |
cu_h_flags | 0 | CU_H_UPPER_LIMIT_T1 | At least one line is an upper limit by the 1% threshold in Hayes et al. (2022, ApJ, 262, 34) |
cu_h_flags | 1 | CU_H_UPPER_LIMIT_T2 | At least one line is an upper limit by the 2% threshold in Hayes et al. (2022, ApJ, 262, 34) |
cu_h_flags | 2 | CU_H_UPPER_LIMIT_T3 | At least one line is an upper limit by the 3% threshold in Hayes et al. (2022, ApJ, 262, 34) |
cu_h_flags | 3 | CU_H_UPPER_LIMIT_T4 | At least one line is an upper limit by the 4% threshold in Hayes et al. (2022, ApJ, 262, 34) |
cu_h_flags | 4 | CU_H_UPPER_LIMIT_T5 | At least one line is an upper limit by the 5% threshold in Hayes et al. (2022, ApJ, 262, 34) |
cu_h_flags | 5 | CU_H_CENSORED_HIGH_TEFF | Censored value because abundances known to be wrong for this Teff |
cu_h_flags | 6 | CU_H_CENSORED_LOW_TEFF_VMICRO | Censored value because it has low Teff and v_micro |
cu_h_flags | 7 | CU_H_CENSORED_UNPHYSICAL | Censored value because FERRE returned unphysical value |
cu_h_flags | 8 | CU_H_BAD_GRID_EDGE | Grid edge bad |
cu_h_flags | 9 | CU_H_WARN_GRID_EDGE | Grid edge warning |
cu_h_flags | 10 | CU_H_WARN_TEFF | These abundances are known to be unreliable for this Teff |
cu_h_flags | 11 | CU_H_WARN_M_H | These abundances are known to be unreliable for this [M/H] |
fe_h_flags | 5 | FE_H_CENSORED_HIGH_TEFF | Censored value because abundances known to be wrong for this Teff |
fe_h_flags | 6 | FE_H_CENSORED_LOW_TEFF_VMICRO | Censored value because it has low Teff and v_micro |
fe_h_flags | 7 | FE_H_CENSORED_UNPHYSICAL | Censored value because FERRE returned unphysical value |
fe_h_flags | 8 | FE_H_BAD_GRID_EDGE | Grid edge bad |
fe_h_flags | 9 | FE_H_WARN_GRID_EDGE | Grid edge warning |
fe_h_flags | 10 | FE_H_WARN_TEFF | These abundances are known to be unreliable for this Teff |
fe_h_flags | 11 | FE_H_WARN_M_H | These abundances are known to be unreliable for this [M/H] |
k_h_flags | 5 | K_H_CENSORED_HIGH_TEFF | Censored value because abundances known to be wrong for this Teff |
k_h_flags | 6 | K_H_CENSORED_LOW_TEFF_VMICRO | Censored value because it has low Teff and v_micro |
k_h_flags | 7 | K_H_CENSORED_UNPHYSICAL | Censored value because FERRE returned unphysical value |
k_h_flags | 8 | K_H_BAD_GRID_EDGE | Grid edge bad |
k_h_flags | 9 | K_H_WARN_GRID_EDGE | Grid edge warning |
k_h_flags | 10 | K_H_WARN_TEFF | These abundances are known to be unreliable for this Teff |
k_h_flags | 11 | K_H_WARN_M_H | These abundances are known to be unreliable for this [M/H] |
mg_h_flags | 5 | MG_H_CENSORED_HIGH_TEFF | Censored value because abundances known to be wrong for this Teff |
mg_h_flags | 6 | MG_H_CENSORED_LOW_TEFF_VMICRO | Censored value because it has low Teff and v_micro |
mg_h_flags | 7 | MG_H_CENSORED_UNPHYSICAL | Censored value because FERRE returned unphysical value |
mg_h_flags | 8 | MG_H_BAD_GRID_EDGE | Grid edge bad |
mg_h_flags | 9 | MG_H_WARN_GRID_EDGE | Grid edge warning |
mg_h_flags | 10 | MG_H_WARN_TEFF | These abundances are known to be unreliable for this Teff |
mg_h_flags | 11 | MG_H_WARN_M_H | These abundances are known to be unreliable for this [M/H] |
mn_h_flags | 5 | MN_H_CENSORED_HIGH_TEFF | Censored value because abundances known to be wrong for this Teff |
mn_h_flags | 6 | MN_H_CENSORED_LOW_TEFF_VMICRO | Censored value because it has low Teff and v_micro |
mn_h_flags | 7 | MN_H_CENSORED_UNPHYSICAL | Censored value because FERRE returned unphysical value |
mn_h_flags | 8 | MN_H_BAD_GRID_EDGE | Grid edge bad |
mn_h_flags | 9 | MN_H_WARN_GRID_EDGE | Grid edge warning |
mn_h_flags | 10 | MN_H_WARN_TEFF | These abundances are known to be unreliable for this Teff |
mn_h_flags | 11 | MN_H_WARN_M_H | These abundances are known to be unreliable for this [M/H] |
na_h_flags | 0 | NA_H_UPPER_LIMIT_T1 | At least one line is an upper limit by the 1% threshold in Hayes et al. (2022, ApJ, 262, 34) |
na_h_flags | 1 | NA_H_UPPER_LIMIT_T2 | At least one line is an upper limit by the 2% threshold in Hayes et al. (2022, ApJ, 262, 34) |
na_h_flags | 2 | NA_H_UPPER_LIMIT_T3 | At least one line is an upper limit by the 3% threshold in Hayes et al. (2022, ApJ, 262, 34) |
na_h_flags | 3 | NA_H_UPPER_LIMIT_T4 | At least one line is an upper limit by the 4% threshold in Hayes et al. (2022, ApJ, 262, 34) |
na_h_flags | 4 | NA_H_UPPER_LIMIT_T5 | At least one line is an upper limit by the 5% threshold in Hayes et al. (2022, ApJ, 262, 34) |
na_h_flags | 5 | NA_H_CENSORED_HIGH_TEFF | Censored value because abundances known to be wrong for this Teff |
na_h_flags | 6 | NA_H_CENSORED_LOW_TEFF_VMICRO | Censored value because it has low Teff and v_micro |
na_h_flags | 7 | NA_H_CENSORED_UNPHYSICAL | Censored value because FERRE returned unphysical value |
na_h_flags | 8 | NA_H_BAD_GRID_EDGE | Grid edge bad |
na_h_flags | 9 | NA_H_WARN_GRID_EDGE | Grid edge warning |
na_h_flags | 10 | NA_H_WARN_TEFF | These abundances are known to be unreliable for this Teff |
na_h_flags | 11 | NA_H_WARN_M_H | These abundances are known to be unreliable for this [M/H] |
nd_h_flags | 0 | ND_H_UPPER_LIMIT_T1 | At least one line is an upper limit by the 1% threshold in Hayes et al. (2022, ApJ, 262, 34) |
nd_h_flags | 1 | ND_H_UPPER_LIMIT_T2 | At least one line is an upper limit by the 2% threshold in Hayes et al. (2022, ApJ, 262, 34) |
nd_h_flags | 2 | ND_H_UPPER_LIMIT_T3 | At least one line is an upper limit by the 3% threshold in Hayes et al. (2022, ApJ, 262, 34) |
nd_h_flags | 3 | ND_H_UPPER_LIMIT_T4 | At least one line is an upper limit by the 4% threshold in Hayes et al. (2022, ApJ, 262, 34) |
nd_h_flags | 4 | ND_H_UPPER_LIMIT_T5 | At least one line is an upper limit by the 5% threshold in Hayes et al. (2022, ApJ, 262, 34) |
nd_h_flags | 5 | ND_H_CENSORED_HIGH_TEFF | Censored value because abundances known to be wrong for this Teff |
nd_h_flags | 6 | ND_H_CENSORED_LOW_TEFF_VMICRO | Censored value because it has low Teff and v_micro |
nd_h_flags | 7 | ND_H_CENSORED_UNPHYSICAL | Censored value because FERRE returned unphysical value |
nd_h_flags | 8 | ND_H_BAD_GRID_EDGE | Grid edge bad |
nd_h_flags | 9 | ND_H_WARN_GRID_EDGE | Grid edge warning |
nd_h_flags | 10 | ND_H_WARN_TEFF | These abundances are known to be unreliable for this Teff |
nd_h_flags | 11 | ND_H_WARN_M_H | These abundances are known to be unreliable for this [M/H] |
ni_h_flags | 5 | NI_H_CENSORED_HIGH_TEFF | Censored value because abundances known to be wrong for this Teff |
ni_h_flags | 6 | NI_H_CENSORED_LOW_TEFF_VMICRO | Censored value because it has low Teff and v_micro |
ni_h_flags | 7 | NI_H_CENSORED_UNPHYSICAL | Censored value because FERRE returned unphysical value |
ni_h_flags | 8 | NI_H_BAD_GRID_EDGE | Grid edge bad |
ni_h_flags | 9 | NI_H_WARN_GRID_EDGE | Grid edge warning |
ni_h_flags | 10 | NI_H_WARN_TEFF | These abundances are known to be unreliable for this Teff |
ni_h_flags | 11 | NI_H_WARN_M_H | These abundances are known to be unreliable for this [M/H] |
n_h_flags | 0 | N_H_UPPER_LIMIT_T1 | At least one line is an upper limit by the 1% threshold in Hayes et al. (2022, ApJ, 262, 34) |
n_h_flags | 1 | N_H_UPPER_LIMIT_T2 | At least one line is an upper limit by the 2% threshold in Hayes et al. (2022, ApJ, 262, 34) |
n_h_flags | 2 | N_H_UPPER_LIMIT_T3 | At least one line is an upper limit by the 3% threshold in Hayes et al. (2022, ApJ, 262, 34) |
n_h_flags | 3 | N_H_UPPER_LIMIT_T4 | At least one line is an upper limit by the 4% threshold in Hayes et al. (2022, ApJ, 262, 34) |
n_h_flags | 4 | N_H_UPPER_LIMIT_T5 | At least one line is an upper limit by the 5% threshold in Hayes et al. (2022, ApJ, 262, 34) |
n_h_flags | 5 | N_H_CENSORED_HIGH_TEFF | Censored value because abundances known to be wrong for this Teff |
n_h_flags | 6 | N_H_CENSORED_LOW_TEFF_VMICRO | Censored value because it has low Teff and v_micro |
n_h_flags | 7 | N_H_CENSORED_UNPHYSICAL | Censored value because FERRE returned unphysical value |
n_h_flags | 8 | N_H_BAD_GRID_EDGE | Grid edge bad |
n_h_flags | 9 | N_H_WARN_GRID_EDGE | Grid edge warning |
n_h_flags | 10 | N_H_WARN_TEFF | These abundances are known to be unreliable for this Teff |
n_h_flags | 11 | N_H_WARN_M_H | These abundances are known to be unreliable for this [M/H] |
o_h_flags | 0 | O_H_UPPER_LIMIT_T1 | At least one line is an upper limit by the 1% threshold in Hayes et al. (2022, ApJ, 262, 34) |
o_h_flags | 1 | O_H_UPPER_LIMIT_T2 | At least one line is an upper limit by the 2% threshold in Hayes et al. (2022, ApJ, 262, 34) |
o_h_flags | 2 | O_H_UPPER_LIMIT_T3 | At least one line is an upper limit by the 3% threshold in Hayes et al. (2022, ApJ, 262, 34) |
o_h_flags | 3 | O_H_UPPER_LIMIT_T4 | At least one line is an upper limit by the 4% threshold in Hayes et al. (2022, ApJ, 262, 34) |
o_h_flags | 4 | O_H_UPPER_LIMIT_T5 | At least one line is an upper limit by the 5% threshold in Hayes et al. (2022, ApJ, 262, 34) |
o_h_flags | 5 | O_H_CENSORED_HIGH_TEFF | Censored value because abundances known to be wrong for this Teff |
o_h_flags | 6 | O_H_CENSORED_LOW_TEFF_VMICRO | Censored value because it has low Teff and v_micro |
o_h_flags | 7 | O_H_CENSORED_UNPHYSICAL | Censored value because FERRE returned unphysical value |
o_h_flags | 8 | O_H_BAD_GRID_EDGE | Grid edge bad |
o_h_flags | 9 | O_H_WARN_GRID_EDGE | Grid edge warning |
o_h_flags | 10 | O_H_WARN_TEFF | These abundances are known to be unreliable for this Teff |
o_h_flags | 11 | O_H_WARN_M_H | These abundances are known to be unreliable for this [M/H] |
p_h_flags | 0 | P_H_UPPER_LIMIT_T1 | At least one line is an upper limit by the 1% threshold in Hayes et al. (2022, ApJ, 262, 34) |
p_h_flags | 1 | P_H_UPPER_LIMIT_T2 | At least one line is an upper limit by the 2% threshold in Hayes et al. (2022, ApJ, 262, 34) |
p_h_flags | 2 | P_H_UPPER_LIMIT_T3 | At least one line is an upper limit by the 3% threshold in Hayes et al. (2022, ApJ, 262, 34) |
p_h_flags | 3 | P_H_UPPER_LIMIT_T4 | At least one line is an upper limit by the 4% threshold in Hayes et al. (2022, ApJ, 262, 34) |
p_h_flags | 4 | P_H_UPPER_LIMIT_T5 | At least one line is an upper limit by the 5% threshold in Hayes et al. (2022, ApJ, 262, 34) |
p_h_flags | 5 | P_H_CENSORED_HIGH_TEFF | Censored value because abundances known to be wrong for this Teff |
p_h_flags | 6 | P_H_CENSORED_LOW_TEFF_VMICRO | Censored value because it has low Teff and v_micro |
p_h_flags | 7 | P_H_CENSORED_UNPHYSICAL | Censored value because FERRE returned unphysical value |
p_h_flags | 8 | P_H_BAD_GRID_EDGE | Grid edge bad |
p_h_flags | 9 | P_H_WARN_GRID_EDGE | Grid edge warning |
p_h_flags | 10 | P_H_WARN_TEFF | These abundances are known to be unreliable for this Teff |
p_h_flags | 11 | P_H_WARN_M_H | These abundances are known to be unreliable for this [M/H] |
si_h_flags | 5 | SI_H_CENSORED_HIGH_TEFF | Censored value because abundances known to be wrong for this Teff |
si_h_flags | 6 | SI_H_CENSORED_LOW_TEFF_VMICRO | Censored value because it has low Teff and v_micro |
si_h_flags | 7 | SI_H_CENSORED_UNPHYSICAL | Censored value because FERRE returned unphysical value |
si_h_flags | 8 | SI_H_BAD_GRID_EDGE | Grid edge bad |
si_h_flags | 9 | SI_H_WARN_GRID_EDGE | Grid edge warning |
si_h_flags | 10 | SI_H_WARN_TEFF | These abundances are known to be unreliable for this Teff |
si_h_flags | 11 | SI_H_WARN_M_H | These abundances are known to be unreliable for this [M/H] |
s_h_flags | 0 | S_H_UPPER_LIMIT_T1 | At least one line is an upper limit by the 1% threshold in Hayes et al. (2022, ApJ, 262, 34) |
s_h_flags | 1 | S_H_UPPER_LIMIT_T2 | At least one line is an upper limit by the 2% threshold in Hayes et al. (2022, ApJ, 262, 34) |
s_h_flags | 2 | S_H_UPPER_LIMIT_T3 | At least one line is an upper limit by the 3% threshold in Hayes et al. (2022, ApJ, 262, 34) |
s_h_flags | 3 | S_H_UPPER_LIMIT_T4 | At least one line is an upper limit by the 4% threshold in Hayes et al. (2022, ApJ, 262, 34) |
s_h_flags | 4 | S_H_UPPER_LIMIT_T5 | At least one line is an upper limit by the 5% threshold in Hayes et al. (2022, ApJ, 262, 34) |
s_h_flags | 5 | S_H_CENSORED_HIGH_TEFF | Censored value because abundances known to be wrong for this Teff |
s_h_flags | 6 | S_H_CENSORED_LOW_TEFF_VMICRO | Censored value because it has low Teff and v_micro |
s_h_flags | 7 | S_H_CENSORED_UNPHYSICAL | Censored value because FERRE returned unphysical value |
s_h_flags | 8 | S_H_BAD_GRID_EDGE | Grid edge bad |
s_h_flags | 9 | S_H_WARN_GRID_EDGE | Grid edge warning |
s_h_flags | 10 | S_H_WARN_TEFF | These abundances are known to be unreliable for this Teff |
s_h_flags | 11 | S_H_WARN_M_H | These abundances are known to be unreliable for this [M/H] |
ti_h_flags | 5 | TI_H_CENSORED_HIGH_TEFF | Censored value because abundances known to be wrong for this Teff |
ti_h_flags | 6 | TI_H_CENSORED_LOW_TEFF_VMICRO | Censored value because it has low Teff and v_micro |
ti_h_flags | 7 | TI_H_CENSORED_UNPHYSICAL | Censored value because FERRE returned unphysical value |
ti_h_flags | 8 | TI_H_BAD_GRID_EDGE | Grid edge bad |
ti_h_flags | 9 | TI_H_WARN_GRID_EDGE | Grid edge warning |
ti_h_flags | 10 | TI_H_WARN_TEFF | These abundances are known to be unreliable for this Teff |
ti_h_flags | 11 | TI_H_WARN_M_H | These abundances are known to be unreliable for this [M/H] |
ti_2_h_flags | 5 | TI_2_H_CENSORED_HIGH_TEFF | Censored value because abundances known to be wrong for this Teff |
ti_2_h_flags | 6 | TI_2_H_CENSORED_LOW_TEFF_VMICRO | Censored value because it has low Teff and v_micro |
ti_2_h_flags | 7 | TI_2_H_CENSORED_UNPHYSICAL | Censored value because FERRE returned unphysical value |
ti_2_h_flags | 8 | TI_2_H_BAD_GRID_EDGE | Grid edge bad |
ti_2_h_flags | 9 | TI_2_H_WARN_GRID_EDGE | Grid edge warning |
ti_2_h_flags | 10 | TI_2_H_WARN_TEFF | These abundances are known to be unreliable for this Teff |
ti_2_h_flags | 11 | TI_2_H_WARN_M_H | These abundances are known to be unreliable for this [M/H] |
v_h_flags | 0 | V_H_UPPER_LIMIT_T1 | At least one line is an upper limit by the 1% threshold in Hayes et al. (2022, ApJ, 262, 34) |
v_h_flags | 1 | V_H_UPPER_LIMIT_T2 | At least one line is an upper limit by the 2% threshold in Hayes et al. (2022, ApJ, 262, 34) |
v_h_flags | 2 | V_H_UPPER_LIMIT_T3 | At least one line is an upper limit by the 3% threshold in Hayes et al. (2022, ApJ, 262, 34) |
v_h_flags | 3 | V_H_UPPER_LIMIT_T4 | At least one line is an upper limit by the 4% threshold in Hayes et al. (2022, ApJ, 262, 34) |
v_h_flags | 4 | V_H_UPPER_LIMIT_T5 | At least one line is an upper limit by the 5% threshold in Hayes et al. (2022, ApJ, 262, 34) |
v_h_flags | 5 | V_H_CENSORED_HIGH_TEFF | Censored value because abundances known to be wrong for this Teff |
v_h_flags | 6 | V_H_CENSORED_LOW_TEFF_VMICRO | Censored value because it has low Teff and v_micro |
v_h_flags | 7 | V_H_CENSORED_UNPHYSICAL | Censored value because FERRE returned unphysical value |
v_h_flags | 8 | V_H_BAD_GRID_EDGE | Grid edge bad |
v_h_flags | 9 | V_H_WARN_GRID_EDGE | Grid edge warning |
v_h_flags | 10 | V_H_WARN_TEFF | These abundances are known to be unreliable for this Teff |
v_h_flags | 11 | V_H_WARN_M_H | These abundances are known to be unreliable for this [M/H] |
initial_flags | 0 | INITIAL_GUESS_FROM_APOGEENET | Initial guess from APOGEENet |
initial_flags | 1 | INITIAL_GUESS_FROM_DOPPLER | Initial guess from Doppler (SDSS-V) |
initial_flags | 1 | INITIAL_GUESS_FROM_DOPPLER_SDSS4 | Initial guess from Doppler (SDSS-IV) |
initial_flags | 2 | INITIAL_GUESS_FROM_USER | Initial guess specified by user |
initial_flags | 3 | INITIAL_GUESS_FROM_GAIA_XP_ANDRAE23 | Initial guess from Andrae et al. (2023) |
result_flags | 0 | FERRE_FAIL | FERRE failed |
result_flags | 1 | MISSING_MODEL_FLUX | Missing model fluxes from FERRE |
result_flags | 2 | POTENTIAL_FERRE_TIMEOUT | Potentially impacted by FERRE timeout |
result_flags | 3 | NO_SUITABLE_INITIAL_GUESS | FERRE not executed because there’s no suitable initial guess |
result_flags | 4 | SPECTRUM_IO_ERROR | Error accessing spectrum pixel data |
result_flags | 5 | TEFF_GRID_EDGE_WARN | Teff is within one step from the grid edge |
result_flags | 6 | TEFF_GRID_EDGE_BAD | Teff is within 1/8th of a step from the grid edge |
result_flags | 7 | LOGG_GRID_EDGE_WARN | logg is within one step from the grid edge |
result_flags | 8 | LOGG_GRID_EDGE_BAD | logg is within 1/8th of a step from the grid edge |
result_flags | 9 | V_MICRO_GRID_EDGE_WARN | v_micro is within one step from the grid edge |
result_flags | 10 | V_MICRO_GRID_EDGE_BAD | v_micro is within 1/8th of a step from the grid edge |
result_flags | 11 | V_SINI_GRID_EDGE_WARN | v_sini is within one step from the highest grid edge |
result_flags | 12 | V_SINI_GRID_EDGE_BAD | v_sini is within 1/8th of a step from the highest grid edge |
result_flags | 13 | M_H_ATM_GRID_EDGE_WARN | [M/H] is within one step from the grid edge |
result_flags | 14 | M_H_ATM_GRID_EDGE_BAD | [M/H] is within 1/8th of a step from the grid edge |
result_flags | 15 | ALPHA_M_GRID_EDGE_WARN | [alpha/M] is within one step from the grid edge |
result_flags | 16 | ALPHA_M_GRID_EDGE_BAD | [alpha/M] is within 1/8th of a step from the grid edge |
result_flags | 17 | C_M_ATM_GRID_EDGE_WARN | [C/M] is within one step from the grid edge |
result_flags | 18 | C_M_ATM_GRID_EDGE_BAD | [C/M] is within 1/8th of a step from the grid edge |
result_flags | 19 | N_M_ATM_GRID_EDGE_WARN | [N/M] is within one step from the grid edge |
result_flags | 20 | N_M_ATM_GRID_EDGE_BAD | [N/M] is within 1/8th of a step from the grid edge |
result_flags | 21 | SUSPICIOUS_PARAMETERS | Stellar parameters are in a suspicious and low-density region |
result_flags | 22 | HIGH_V_SINI | High rotational velocity |
result_flags | 23 | HIGH_V_MICRO | v_micro exceeds 3 km/s |
result_flags | 24 | UNPHYSICAL_PARAMETERS | FERRE returned unphysical stellar parameters |
result_flags | 25 | HIGH_RCHI2 | Reduced chi-squared is greater than 1000 |
result_flags | 26 | LOW_SNR | S/N is less than 20 |
result_flags | 27 | HIGH_STD_V_RAD | Standard deviation of v_rad is greater than 1 km/s |
calibrated_flags | 0 | AS_DWARF_FOR_CALIBRATION | Classified as main-sequence star for logg calibration |
calibrated_flags | 1 | AS_GIANT_FOR_CALIBRATION | Classified as red giant branch star for logg calibration |
calibrated_flags | 2 | AS_RED_CLUMP_FOR_CALIBRATION | Classified as red clump star for logg calibration |
calibrated_flags | 3 | AS_M_DWARF_FOR_CALIBRATION | Classifed as M-dwarf for teff and logg calibration |
calibrated_flags | 4 | CENSORED_LOGG_FOR_METAL_POOR_M_DWARF | Censored logg for metal-poor ([M/H] < -0.6) M-dwarf |
flag_warn | — | WARN | If any result_flags are set. |
flag_bad | — | BAD | If any of the following flags are set: SUSPICIOUS_PARAMETERS, HIGH_V_SINI, HIGH_V_MICRO, UNPHYSICAL_PARAMETERS, HIGH_RCHI2, LOW_SNR, HIGH_STD_V_RAD, TEFF_GRID_EDGE_BAD, LOGG_GRID_EDGE_BAD, FERRE_FAIL, MISSING_MODEL_FLUX, POTENTIAL_FERRE_TIMEOUT, NO_SUITABLE_INITIAL_GUESS, SPECTRUM_IO_ERROR. |