Summary
LineForest (Saad et al. 2024) is a pipeline that measures the integrated line strengths (equivalent widths) of numerous key transitions in BOSS spectra using a neural network. A neural network approach was adopted because other methods attempted, such as Gaussian profile fitting, automated continuum determination, and automated width estimation, could not be generalized across all sources and only worked well for a subset of stars.
Detailed Description
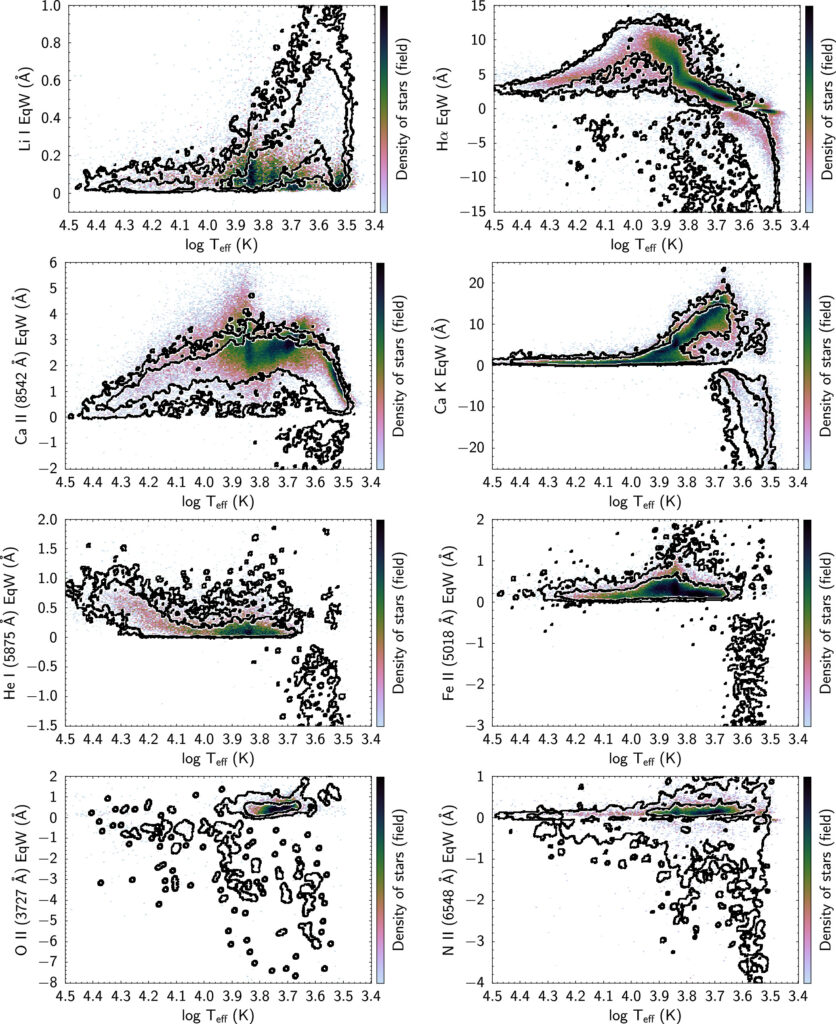
The LineForest pipeline derives equivalent widths from MWM BOSS spectra based on a convolution neural net trained on by-hand equivalent width measurements from ~3500 BOSS spectra spanning a range of target classes from young stellar objects to OB stars to cataclysmic variables.
List of Line Indices
Table 1 from Saad et al. (2024) is reproduced below:
| Line | Lambda (Å) | Delta Lambda (Å) | Precision (dex) | Recall (dex) | EqW sigma | AbW sigma | Notes |
| Halpha | 6562.8 | 200 | 0.98 | 0.96 | 0.08 | 0.09 | |
| Hbeta | 4861.3 | 200 | 0.98 | 0.94 | 0.09 | 0.1 | |
| Hgamma | 4340.5 | 200 | 0.95 | 0.93 | 0.1 | 0.12 | |
| Hdelta | 4101.7 | 200 | 0.94 | 0.94 | 0.1 | 0.11 | |
| Hepsilon | 3970.1 | 200 | 0.95 | 0.94 | 0.08 | 0.1 | [E]; Ca II H blend |
| H8 | 3889.064 | 200 | 0.91 | 0.66 | 0.08 | 0.06 | |
| H9 | 3835.391 | 200 | 0.91 | 0.71 | 0.11 | 0.1 | |
| H10 | 3797.904 | 200 | 0.82 | 0.77 | 0.12 | 0.08 | |
| H11 | 3770.637 | 200 | 0.9 | 0.72 | 0.1 | 0.08 | |
| H12 | 3750.158 | 50 | 0.85 | 0.79 | 0.14 | 0.09 | |
| H13 | 3734.369 | 50 | 0.77 | 0.65 | 0.13 | 0.09 | |
| H14 | 3721.945 | 50 | 0.87 | 0.68 | 0.09 | 0.07 | |
| H15 | 3711.977 | 50 | 0.87 | 0.81 | 0.12 | 0.15 | |
| H16 | 3703.859 | 50 | 0.88 | 0.7 | |||
| H17 | 3697.157 | 50 | 0.56 | 0.38 | 0.11 | 0.2 | |
| Pa7 | 10049.4889 | 200 | 0.9 | 0.84 | 0.13 | 0.14 | |
| Pa8 | 9546.0808 | 200 | 0.93 | 0.9 | 0.12 | 0.11 | |
| Pa9 | 9229.1200 | 200 | 0.92 | 0.85 | 0.11 | 0.12 | |
| Pa10 | 9014.909 | 200 | 0.83 | 0.72 | 0.16 | 0.17 | |
| Pa11 | 8862.782 | 200 | 0.86 | 0.78 | 0.08 | 0.12 | |
| Pa12 | 8750.472 | 200 | 0.86 | 0.92 | 0.11 | 0.11 | |
| Pa13 | 8665.019 | 200 | 0.73 | 1.0 | 0.07 | 0.08 | [E]; Ca II 8662.140 Å blend |
| Pa14 | 8598.392 | 200 | 0.75 | 0.9 | 0.11 | 0.08 | |
| Pa15 | 8545.383 | 200 | 0.83 | 0.83 | [E]; Ca II 8542.089 Å blend | ||
| Pa16 | 8502.483 | 200 | 0.62 | 1.0 | [E]; Ca II 8498.018 Å blend | ||
| Pa17 | 8467.254 | 200 | 0.73 | 0.8 | |||
| Ca II | 8662.140 | 50 | 0.99 | 0.96 | 0.06 | 0.07 | [L]; Pa 13 blend |
| Ca II | 8542.089 | 50 | 0.98 | 0.98 | 0.06 | 0.07 | [L]; Pa 15 blend |
| Ca II | 8498.018 | 50 | 0.97 | 0.94 | 0.07 | 0.07 | [L]; Pa 16 blend |
| Ca II K | 3933.6614 | 200 | 0.94 | 0.92 | 0.08 | 0.08 | |
| Ca II H | 3968.4673 | 200 | 0.96 | 0.92 | 0.07 | 0.08 | [L]; Hepsilon blend |
| He I | 6678.151 | 50 | 0.92 | 0.83 | 0.13 | 0.08 | [E]; Fe I 6678 Å blend |
| He I | 5875.621 | 50 | 0.71 | 0.55 | 0.13 | 0.1 | [E] |
| He I | 5015.678 | 50 | 0.43 | 0.51 | 0.15 | 0.17 | [E]; Fe II 5018 Aring blend |
| He I | 4471.479 | 50 | 0.81 | 0.62 | 0.14 | 0.11 | [E] |
| He II | 4685.7 | 50 | 0.08 | 0.38 | [E] | ||
| N II | 6583.450 | 50 | 0.74 | 0.66 | 0.19 | 0.11 | |
| N II | 6548.050 | 50 | 0.65 | 0.53 | 0.21 | 0.12 | |
| S II | 6716.440 | 50 | 0.81 | 0.74 | 0.12 | 0.08 | |
| S II | 6730.816 | 50 | 0.69 | 0.59 | 0.16 | 0.1 | |
| Fe II | 5018.434 | 50 | 0.76 | 0.85 | 0.15 | 0.16 | |
| Fe II | 5169.030 | 50 | 0.81 | 0.81 | 0.09 | 0.08 | |
| Fe II | 5197.577 | 50 | 0.57 | 1.0 | |||
| Fe II | 6432.680 | 50 | 0.71 | 0.5 | |||
| O I | 5577.339 | 50 | 0.8 | 0.53 | 0.12 | 0.06 | |
| O I | 6300.304 | 50 | 0.47 | 0.56 | 0.19 | 0.11 | |
| O I | 6363.777 | 50 | 0.2 | 0.25 | |||
| O II | 3727.42 | 50 | 0.82 | 0.53 | 0.23 | 0.17 | [E]; Fe I 3727 Å blend |
| O III | 4958.911 | 50 | 0.5 | 0.33 | [E] | ||
| O III | 5006.843 | 50 | 0.78 | 0.78 | 0.16 | 0.06 | [E] |
| O III | 4363.85 | 50 | 1.0 | 0.33 | [E] | ||
| Li I | 6707.760 | 50 | 0.88 | 0.64 | 0.12 | 0.09 | [L]; Fe I 6707 Å blend |
Validation and Uncertainties
The development of LineForest was motivated by YSO studies. In Saad et al. (2024), the indices are shown to correlate well with YSO properties.
However, how well LineForest works for other types of stars is less well vetted. For example, although CVs were included in the training set, comparison of CVs identified by visual inspection with those identified by Hα emission show poor overlap.
Data Products
LineForest expects rest-frame BOSS spectra sampled onto the common wavelength array.
LineForest runs on the `mwmStar` (combined) BOSS spectra and the `mwmVisit` (individual visit) BOSS spectra.
LineForest produces only summary data products: the `astraAllStarLineForest` product contains results based on combined `mwmStar` BOSS spectra, and the `astraAllVisitLineForest` product contains results based on `mwmVIsit` BOSS spectra.
Flags
There are no flags for the LineForest measurements.