Summary
Snow White is a pipeline specifically designed for analyzing white dwarfs. There are two components of Snow White:
- A classifier that reports the type of white dwarf based on line indices.
- Stellar parameters based on model spectrum fits around hydrogen lines, using Gaia astrometry and photometry to differentiate between potentially multimodal solutions.
Detailed Description
This classifier is a Random Forest algorithm trained on 30,000 SDSS I – IV spectra classified by expert human inspection and detailed in Gentile Fusillo et al. (2021). Cool white dwarfs are signficantly underepresented in this sample so the training set was expanded with the inclusion of 3,000 model DA white dwarf spectra corresponding to effective temperatures in the range 3000-7000 K and spanning surface gravities of 7< log g<9.5 dex. The spectral resolution of the models was degraded to match that of SDSS and random noise was added to create SDSS-like spectra with signal-to-noise ratios varying between 5 and 30. The classifier uses both information from the continuum shape of the spectra and the profile and strength of individual continuum-normalized lines. The position of these lines is pre-defined as the wavelength range where the strongest spectral features of H, He, C, Ca are normally observed.
Snow White reports relative probabilities for each class, as well as the most probable classification. There are numerous white dwarf types (and subtype classifications). If the most probable classification has a relative probability equal to or exceeding 0.5, we adopt that classification for the white dwarf. Otherwise we examine the relative probability between the second most likely classification and the most likely classification. If the ratio (`p_second_most_likely_classification/p_most_likely_classification`) exceeds 0.6 then the reported classification includes both most probable types (as `<most_likely_type>/<second_most_likely_type>`). If the ratio does not exceed 0.6 then we simply add a “:” suffix to the classification string which indicates an uncertain classification. These classification conventions are strictly for convenience: they can be entirely reconstructed from the relative probabilities that are included in the output file.
The classification step is run first. If the spectrum is classified as being a DA-type white dwarf, or an uncertain DA-type white dwarf (e.g., classification of “DA” or “DA:”) then we estimate the stellar parameters from spectrum fitting around hydrogen lines. The decision about whether to fit stellar parameters is entirely dependent on the current spectrum. For example, if the co-added spectrum suggests the source is a DZ white dwarf, but if the classification of a lower signal-to-noise ratio suggests the source is a DA white dwarf, then there will be stellar parameters estimated for that visit spectrum, but not for the combined spectrum.
For DA-type white dwarfs we continuum normalize the spectra with cubic splines based on predefined windows and knot points. The continuum-normalized and cropped Balmer-line profiles are then compared with the Koester 2010 grid of DA-type white dwarf model spectra using a χ2 minimization routine. When available, we adopt photometric best fit parameters from Gentile Fusillo et al. 2021 as the initial guess for the optimization, otherwise we start from the pre-computed grid node which returns the lowest χ2 value in an initial coarse fit. With this initial guess we proceed in the minimization to determine the best stellar parameters. Principal component analysis (PCA) methods within the python scikit-learn package are used to generate models at arbitrary values of Teff and log g between grid nodes.
Balmer line can be profiles are degenerate on either side of Teff=13000 K sometimes leading to a hot and cold solution with similar χ2 values. To obviate this problem we run a second fit restricted to above or below 13000 K (depending on the first solution obtained) . We then use Gaia astrometry to compute synthetic magnitudes and identify the “real” solution as the one that best matches the observed Gaia photometry.
To give flexibility to the model and allow for radial velocity shifts in the observed spectra, the model includes a velocity shift parameter. This is a nuisance parameter heavily dependent on the shape of the Balmer line wings and the spectral noise. Though we report this number we do not recommend its use as a redshift. We report best fitting stellar parameters, associated uncertainties (1 sigma formal uncertainties from the fitting process), and relevant statistics (e.g., χ2 value).
Data Products
Snow White expects rest-frame resampled BOSS spectra, and the pipeline is not suitable for sources that are not white dwarfs. For these reasons, Snow White is only executed on sources that we expect to be white dwarfs based on targeting metadata (which itself depends on photometry and astrometry). For sources assigned to the program `mwm_wd`, which currently includes targeting cartons named `mwm_wd_core_0.1.0` or `mwm_wd_core_0.5.0`, we execute Snow White on all BOSS `mwmStar` (star- and telescope-combined spectra) and `mwmVisit` (individual visit) spectra.
Snow White produces four types of output data products: two summary-level data products (`astraAllStarSnowWhite` and `astraAllVisitSnowWhite`) and two spectrum-level data products (`astraStarSnowWhite` and `astraVisitSnowWhite`).
The two summary files contains results based on combined spectra (`astraAllStarSnowWhite`), and results based on individual visit spectra (`astraAllVisitSnowWhite`). Both summary files include the white dwarf type, the relative probabilities of each type, and for DA-type white dwarfs it includes estimates of the stellar parameters.
The last two data products produced by Snow White include the best-fitting model spectra for all DA-type white dwarfs. These are the `astraStarSnowWhite` and `astraVisitSnowWhite` data products, for analyses of combined and visit spectra, respectively. Like all output spectrum-level data, the best-fit model spectrum is stored as the `model_flux` field, which can be compared to the data by normalizing it with the `continuum` array, which is also stored in the `astraStarSnowWhite` and `astraVisitSnowWhite` files.
Validation and Uncertainties
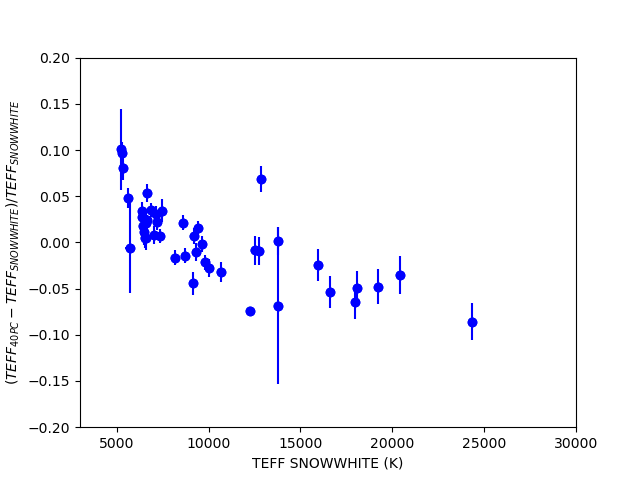
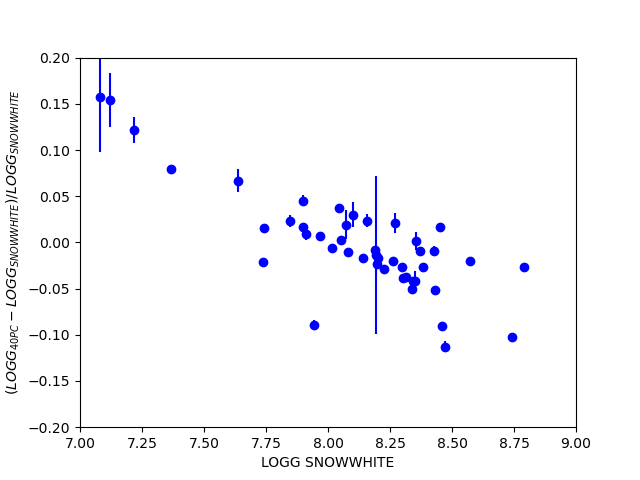
In Figure 1, we compare Teff and log g from Snow White with the results of the photometric analysis of DA white dwarfs within 40 pc by O’Brien et al (2024). We restrict ourselves to stars with ‘p_da’ > 0.7 in Snow White and ‘SpT’=’DA’ in O’Brien et al. The comparison shows good agreement between the values, especially considering the known systematics between spectroscopic and photometric parameters. A larger comparison using the DA WDs within 400 pc from Gentile Fusilio et al. (2021) Gaia DR3 catalog shows similar results.
Flags
| Field Name | Bit | Flag Name | Flag Description |
result_flags | 0 | LOW_SNR | Results are suspect because S/N <= 8 |
result_flags | 1 | UNCONVERGED | Fit did not converge |
result_flags | 2 | TEFF_GRID_EDGE_BAD | TEFF is edge of grid |
result_flags | 3 | LOGG_GRID_EDGE_BAD | LOGG is edge of grid |
result_flags | 4 | NO_FLUX | Spectrum has no flux |