Summary
The Payne (Ting et al. 2019) uses a two-hidden-layer neural network to determine 25 stellar labels simultaneously given a rest-frame resampled APOGEE spectrum. The network is trained on a set of synthetic spectra based on Kurucz atmospheric models. For DR19, we use the same synthetic spectra and model as in Ting et al. (2019).
Detailed Description
The Payne is a general method for the precise and simultaneous determination of numerous stellar labels from observed spectra, based on fitting physical spectral models. The Payne combines a number of important methodological aspects: it exploits the information from much of the available spectral range; it fits all labels (stellar parameters and elemental abundances) simultaneously; it uses spectral models, where the structure of the atmosphere and the radiative transport are consistently calculated to reflect the stellar labels.
The Payne fit 25 stellar labels simultaneously, including Teff, log g, vmicro, vmacro, and 12C/13C along with the 20 elemental abundances (C, N, O, Na, Mg, Al, Si, P, S, K, Ca, Ti, V, Cr, Mn, Fe, Co, Ni, Cu, Ge). The network is trained using 20,000 1D LTE synthetic spectra, which are computed from the codes ATLAS12 and SYNTHE (e.g., Kurucz 2017).
The training labels cover the following ranges:
- Teff: 3000 to 8000 K
- logg: 0 to 5 dex
- vmicro: 0 to 3 km/s
- vmacro: 0.1 to 30 km/s
- 12C/13C: 0.02 to 100
- [Fe/H]: -1.5 to 0.5 dex
- [X/H]: -1.0 to 1.2 dex (X=elements other than Fe)
Data Products
In Data Release 19, The Payne is executed on the combined spectra stored in `apStar` data products, and the rest-frame visit spectra that are also stored in `apStar` files. This includes SDSS-V APOGEE spectra reduced with version 1.4 of the APOGEE data reduction pipeline, and SDSS-IV APOGEE spectra reduced for Data Release 17.
There are two key data products produced by ThePayne and Astra:
- `astraAllStarThePayne: this file contains stellar parameters based on combined spectra in the `apStar` files
- `astraAllVisitThePayne`: this file contains stellar parameters based on visit spectra in the `apStar` files
Validation and Uncertainties
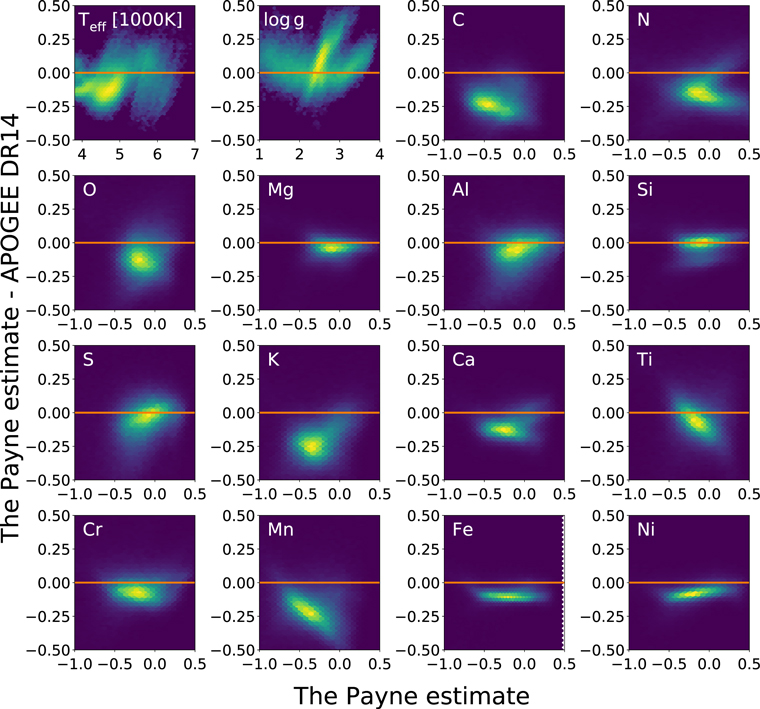
Ting et al. (2019) show extensive validation plots, including The Payne results compared to APOGEE DR14 (then the latest APOGEE data release), The Payne results compared to literature values, and The Payne results for cluster members. We include one plot from their paper as Figure 1.
Comparisons with DR19 ASPCAP results are similar and will be discussed in Casey et al. (in prep).
Ting et al. (2019) caution against overinterpreting values of 12C/13C for dwarfs, as changes in the absorption features for 12C/13C > 50 are weak. The BAWLAS (Hayes et al. 2023) line-by-line analysis of weak lines in APOGEE DR17 included 12C/13C measurements. The agreement between these two 12C/13C measurements is quite poor. Hayes et al. only report measurements for 12C/13C < 20, finding that for larger ratios the strongest 13CO lines did not exceed 1% depth and therefore they report upper limits.
Flags
| Field Name | Bit | Flag Name | Flag Description |
result_flags | 0 | FITTING_FAILURE | Fitting failure |
result_flags | 1 | WARN_TEFF | Teff < 3100 K or Teff > 7900 K |
result_flags | 2 | WARN_LOGG | logg < 0.1 or logg > 5.2 |
result_flags | 3 | WARN_FE_H | [Fe/H] > 0.4 or [Fe/H] < -1.4 |
result_flags | 4 | WARN_LOW_SNR | S/N < 70 |
flag_warn | — | WARN | If any result_flags are set. |
flag_bad | — | BAD | If FITTING_FAILURE is set |