
Overview
The Local Volume Mapper Data Analysis Pipeline, LVM-DAP, (Sánchez et al. 2025) provides higher-level analysis products for the SDSS-V Local Volume Mapper (LVM). The DAP analyzes the reduced row-stacked spectra produced by the LVM Data Reduction Pipeline (DRP), (Mejía-Narváez et al. in prep), i.e., the so-called lvmSFrames, modeling the stellar continuum and measuring the properties of the ionized-gas emission lines for each science fiber.
The main goal of the current LVM-DAP release is to provide robust measurements of emission-line properties (fluxes, equivalent widths, velocities, and velocity dispersions) across the LVM wavelength range with the FoV of the LVM science IFU. The DAP also provides stellar-continuum models and stellar-population information where the continuum signal-to-noise is sufficient.
In DR20, LVM releases DAP products for individual exposures, together with summary files that allow users to identify and select data products. For each analyzed exposure, the release includes a standard DAP file containing the tabulated measurements, and a complementary model file containing the spectra and spectral models generated during the analysis. The DR20 LVM-DAP products were produced with DAP version 1.2.0.251218, paired with DRP version 1.2.0, and should be used together with the corresponding DRP products distributed in the DR20, the corresponding LVM quality-control information, and the tutorials provided for this release. These data can be easily explored using the LVMvis app.
What the LVM-DAP Does
The LVM-DAP analyzes each LVM science spectrum independently, fiber by fiber. In the current implementation, no spatial binning is applied by default. This preserves the native spatial sampling of the LVM science IFU and allows users to construct their own maps, mosaics, radial profiles, or integrated spectra from the delivered tables.
Of the 1801 science fibers contained in each lvmSFrame file, the DAP analyzes and delivers measurements for the 1754 good-quality science fibers those with targettype = 'science' and fibstatus = 0 in the SLITMAP extension of the parent DRP file. Broken or low-quality fibers are not included in the DAP file.
The analysis combines two main components:
- Stellar-continuum modeling: the DAP fits the underlying stellar continuum using a library of Resolved Stellar Population, or RSP, templates. These templates are designed for the LVM regime, where a fiber may contain no star, a single star, a few stars, or a partially resolved stellar population.
- Emission-line analysis: the DAP measures ionized-gas emission lines using both parametric and non-parametric approaches. The parametric analysis fits selected strong lines with Gaussian models, while the non-parametric analysis measures a larger list of lines using a moment-weighted procedure.
The primary science use of the current DAP products is the analysis of the ionized interstellar medium: line-flux maps, line-ratio maps, ionization structure, kinematics, and derived physical conditions. Stellar-population quantities are also provided, but users should treat them with care in fibers where the stellar continuum has low signal-to-noise.
LVM-DAP Workflow
The current LVM-DAP workflow follows the updated sequence used in the Helix Nebula data-products analysis. Before the full fiber-by-fiber analysis is run, the DAP analyzes an integrated spectrum of the exposure. This integrated spectrum is used to estimate the average velocity of the frame and to define stable initial guesses and parameter ranges for the individual fiber fits.
For each individual science fiber, the analysis proceeds through the following stages:
- Estimate stellar non-linear parameters. The DAP derives the stellar velocity, stellar velocity dispersion, and stellar dust attenuation using a compact RSP template library while masking the strongest emission lines.
- First parametric emission-line fit. A first gas spectrum is constructed and the strongest emission lines are fitted with Gaussian models. These first parametric measurements are stored in the
PM_ELINESextension. - Stellar-component modeling. The DAP subtracts the first emission-line model from the observed spectrum and fits the remaining gas-free continuum using a larger RSP library. The resulting stellar-population properties and template coefficients are stored in the
RSPandCOEFFSextensions. - Gas-pure spectrum and continuum-residual cleaning. The best stellar model is subtracted from the observed spectrum. A low-order residual structure is removed to produce a cleaner gas-pure spectrum for emission-line measurements.
- Non-parametric emission-line analysis. A large set of emission lines is measured using a moment-weighted analysis. These measurements are separated by spectrograph arm and stored in
NP_ELINES_B,NP_ELINES_R, andNP_ELINES_I. - Second parametric emission-line fit. The strongest lines are refitted after the final stellar-continuum model has been obtained. These final parametric measurements are stored in the
PM_KELextension. - Emission-line quality information. The DAP stores velocity-dispersion corrections, instrumental-resolution information, and goodness-of-fit quantities in
ELINES_SIGMA_CHIandELINES_CHI2_AVG.
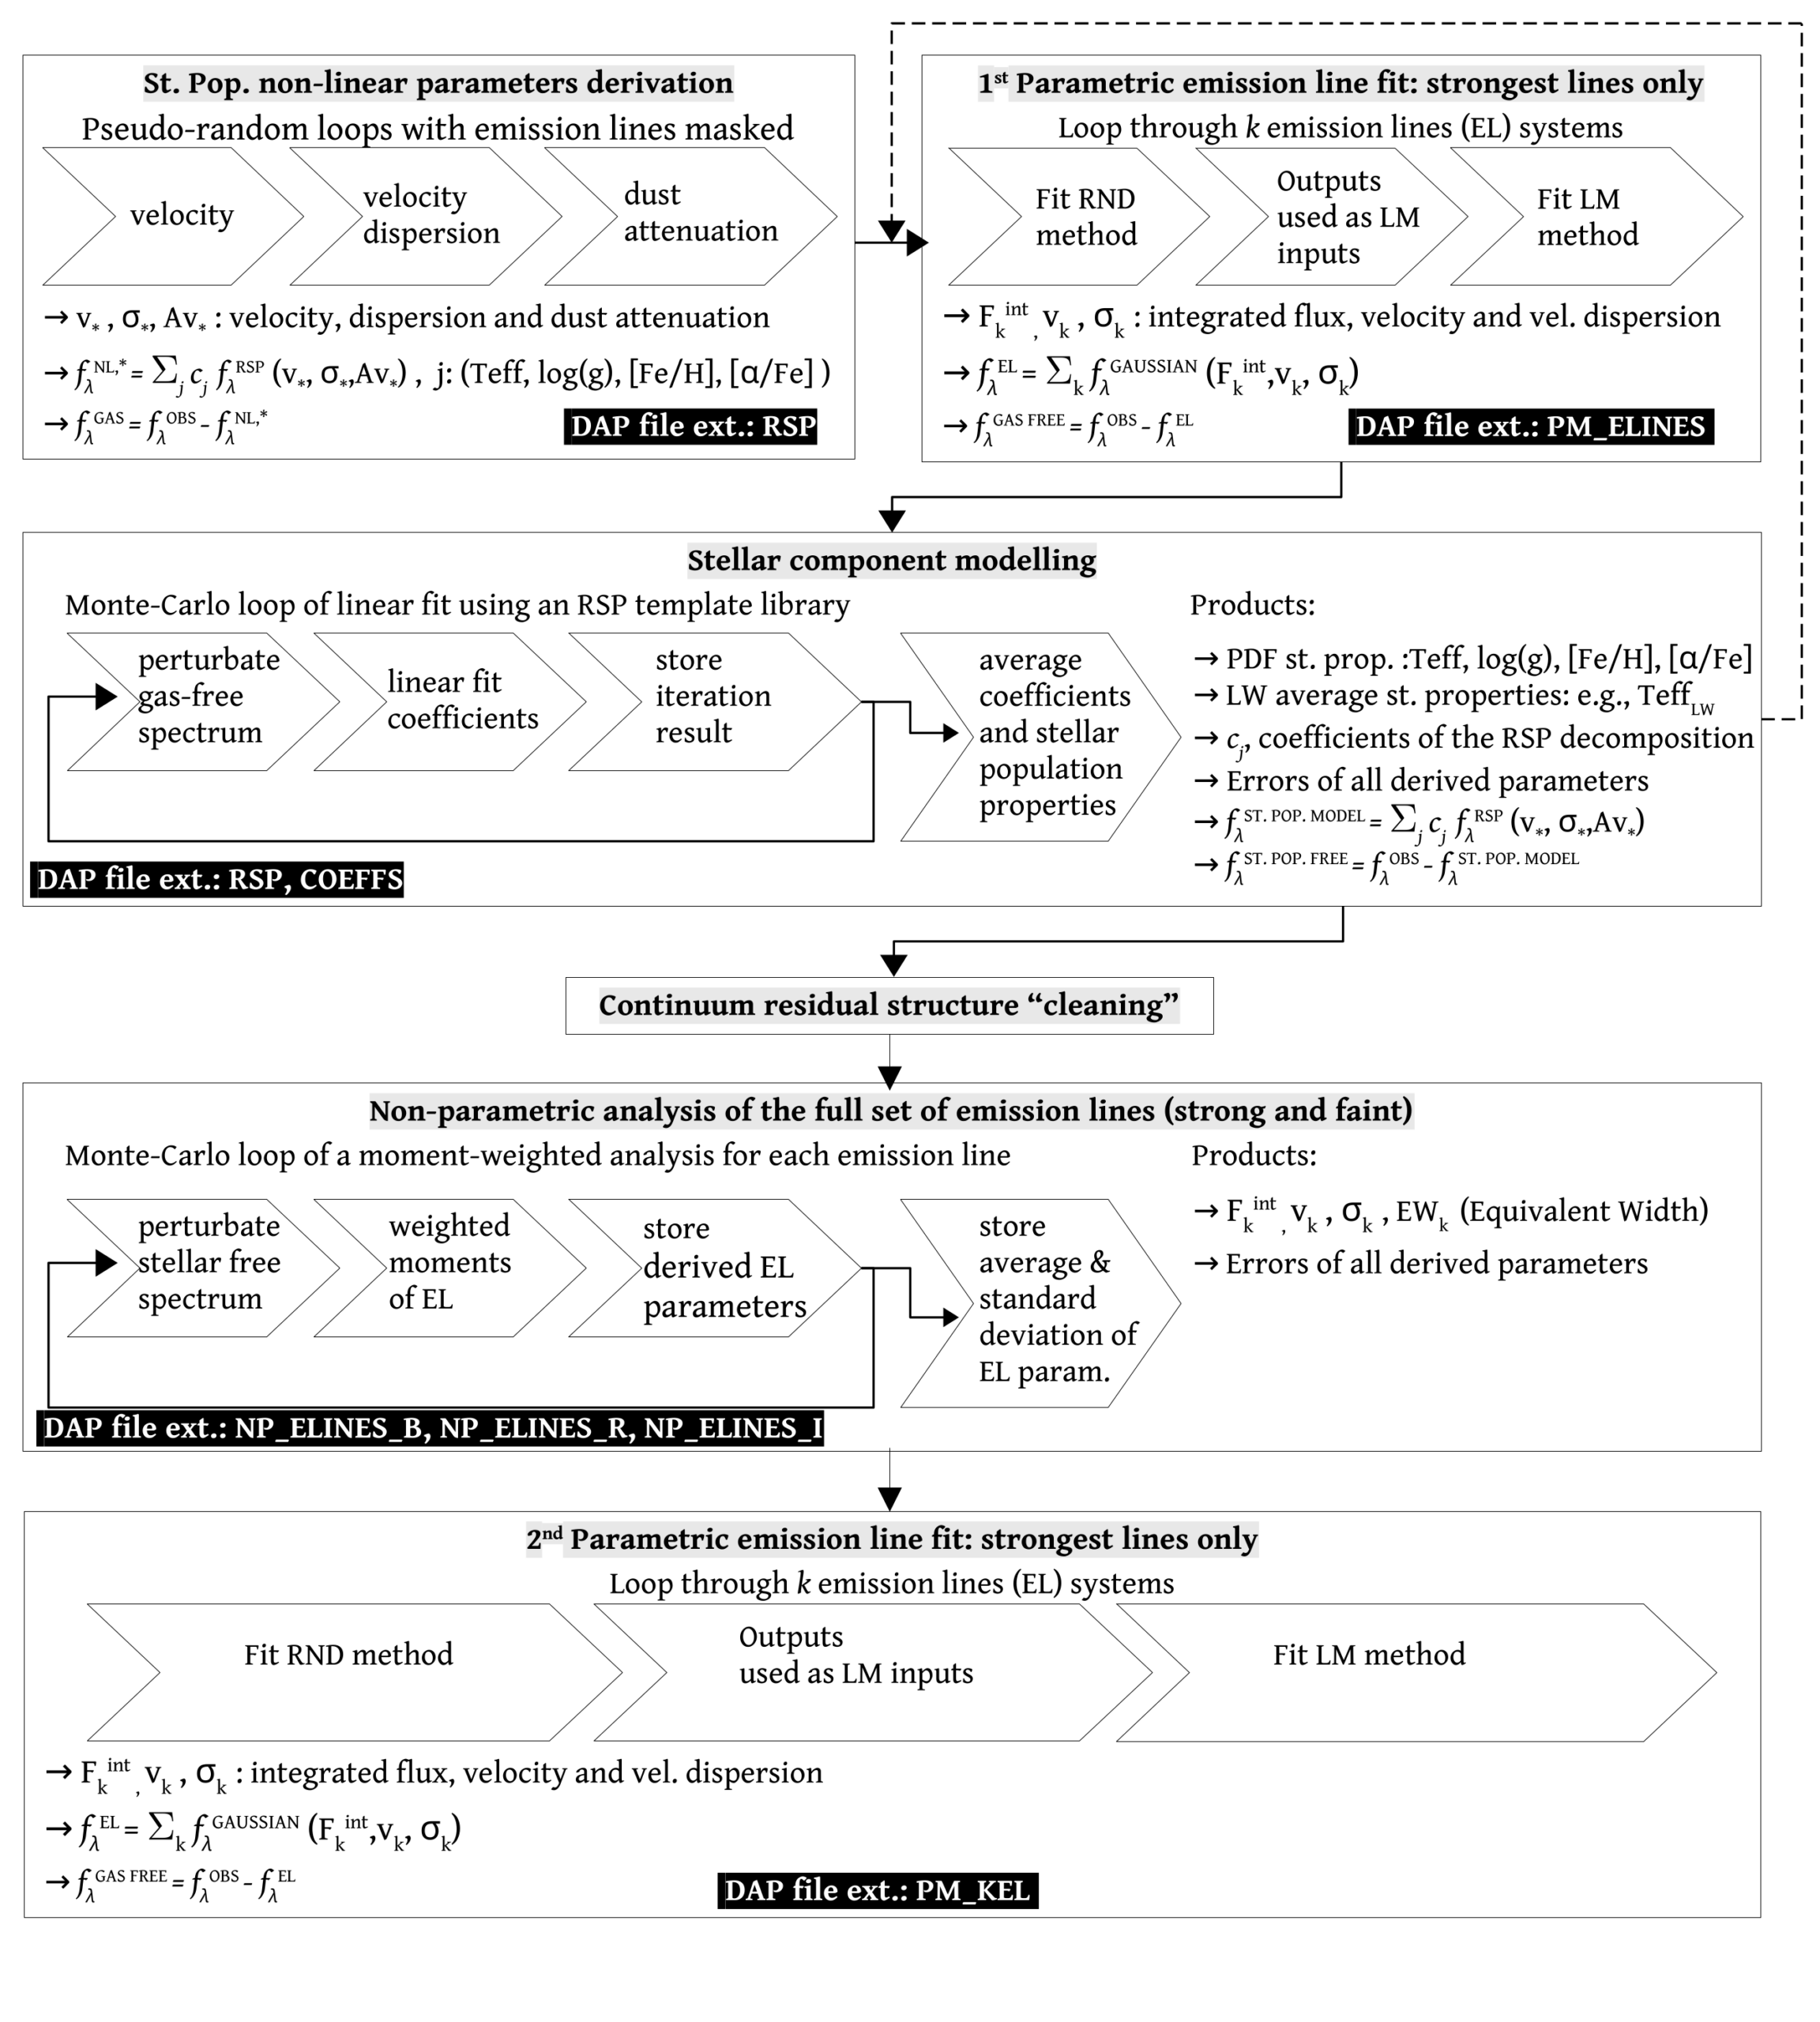
Throughout the analysis, uncertainties are propagated via Monte Carlo simulations that perturb the input fluxes according to the errors provided by the DRP. Each derived parameter is therefore accompanied by a corresponding error estimate.
DR20 DAP Products
For each analyzed LVM exposure, DR20 provides two complementary DAP products:
- The DAP file, a multi-extension FITS file containing tabulated measurements for each analyzed science fiber; and
- The DAP model file, a FITS file containing the observed spectra and the spectral models generated during the DAP analysis.
The DAP file is the main product for science measurements. It contains the stellar-continuum measurements, emission-line fluxes, equivalent widths, velocities, velocity dispersions, fit-quality information, and the position table needed to construct maps. The model file is intended for users who want to inspect the spectral decomposition itself, compare the observed spectra with the stellar and emission-line models, or reconstruct residual and gas-pure spectra.
DAP files
The standard DAP file is a multi-extension FITS file produced for each analyzed LVM exposure following the corresponding datamodel. The DR20 naming convention is:
dap-rsp{#RSP}-sn{SN}-{EXPNUM}.dap.fitsFor example:
dap-rsp108-sn20-00030199.dap.fitsThis filename indicates that the analysis used an RSP library with 108 templates, adopted a minimum signal-to-noise threshold of 20 for the multi-RSP fitting, and corresponds to the exposure number encoded in the filename.
DAP model files
In addition to the standard DAP file, DR20 provides a complementary model file for each analyzed exposure. The model files follow the same naming convention as the DAP files, replacing the .dap.fits suffix with .model.fits:
dap-rsp{#RSP}-sn{SN}-{EXPNUM}.model.fitsFor example, the model file associated with:
dap-rsp108-sn20-00030199.dap.fitsis:
dap-rsp108-sn20-00030199.model.fitsEach model file follows a datamodel that contains a single PRIMARY extension with a three-dimensional data cube. The cube has dimensions:
Nwave x Nspec x 9where Nwave = 12401 is the number of wavelength pixels covering the full LVM spectral range from 3600 to 9800 Å with a uniform sampling of 0.5 Å pixel-1, and Nspec = 1754 is the number of good-quality science fibers delivered in the corresponding DAP file. These are the fibers satisfying targettype = 'science' and fibstatus = 0 in the SLITMAP extension of the parent lvmSFrame.
The nine slices of the model-file cube store and RSS with the following spectral quantities for each fiber:
| Plane | Name | Contents |
|---|---|---|
| 0 | org_spec | Original observed spectrum. |
| 1 | model_spec | Best-fitting stellar continuum model from the full RSP decomposition. |
| 2 | mod_joint_spec | Joint model combining the stellar continuum and the first parametric emission-line fit. |
| 3 | gas_spec | Gas-pure spectrum obtained by subtracting the stellar model from the observed spectrum. |
| 4 | res_joint_spec | Residual spectrum after subtraction of the joint stellar and emission-line model. |
| 5 | no_gas_spec | Gas-free spectrum, i.e. the observed spectrum with the first parametric emission-line model subtracted. |
| 6 | gas_model_NP | Non-parametric model of the emission lines. |
| 7 | gas_model_PEK | Emission-line model from the second parametric fit. |
| 8 | mod_joint_spec_PEK | Joint model combining the stellar continuum and the second parametric emission-line fit. |
The model files are especially useful for visual checks of the spectral modeling (see below), for reconstructing gas-pure or gas-free spectra, and for comparing the first and second parametric emission-line solutions.
DAP Summary File: dapall
In addition to the individual DAP files, DR20 provides a summary file that collects information from the individual DAP products:
dapall-drpver-dapver.fitsFor DR20, drpver = 1.2.0 and dapver = 1.2.0.251218. The dapall file is the recommended starting point for identifying available DAP products and selecting exposures before downloading individual files. Its data model is available here.
The dapall file is distributed in the same SAS directory as the individual DAP files:
https://dr20.sdss.org/sas/dr20/spectro/lvm/analysis/1.2.0/1.2.0.251218
Recommended First Steps
- Open the LVM tutorials and follow the DAP file-reading example.
- Download
dapall-drpver-dapver.fitsfrom the DR20 LVM analysis directory. - Select the exposure or target of interest.
- Download the corresponding individual
dap-*.dap.fitsfile. - Use
PTplus the emission-line extensions to make maps. - Check the quality-control flags and emission-line fit-quality extensions before performing quantitative analysis.
Choosing between parametric and non-parametric measurements
Two independent sets of emission-line measurements are provided for the strong lines: a Gaussian parametric fit (PM_KEL, recommended over the first-pass PM_ELINES) and the moment-weighted non-parametric measurements (NP_ELINES_B, NP_ELINES_R, NP_ELINES_I). The two methods are mutually consistent with median NP/PEK ratios of unity and interquartile ranges below 10% for emission lines with parametric S/N 25, integrated flux 3 10-14 erg s1 cm2, or equivalent width 100 AA. Below these thresholds the scatter between the two methods grows substantially, as expected for measurements approaching the noise floor.
The non-parametric procedure is the only one that delivers equivalent widths and characterizes the full set of 215 emission lines, including faint diagnostic and auroral lines. It is, however, not optimized to handle tightly blended lines or strong night-sky residuals: for blended doublets such as [O II] 3726,3729, or for emission lines that lie on top of strong sky features, the parametric values from PM_KEL are recommended.
Examples of the use of the DAP Products
The DAP products are designed to be used as a set of linked tables, joined through the common id EXPNUM.FIBERID key. The examples below illustrate the main workflows. The images shown on this page are representative outputs from the same family of analyses. To reproducible Python
examples, see the linked DR20 LVM tutorials.
Reading a DAP file with astropy
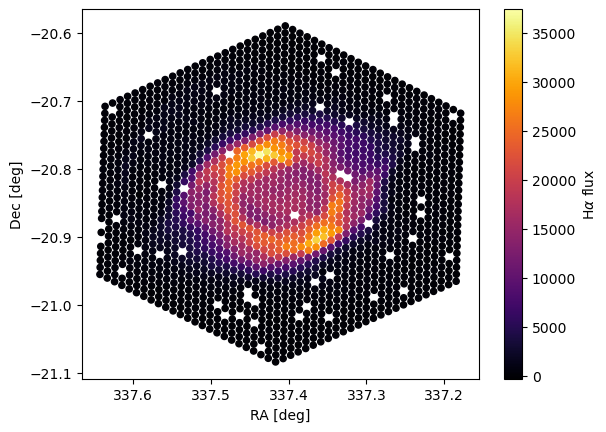
The LVM DAP comprises a set of functions and tools to facilitate the readness of the DAP-file that have been included in a set of notebooks to help the user access the data. To read and explore a single DAP file, open the DAP FITS product, inspect the main extensions (PT, RSP, COEFFS, NP_ELINES_B/R/I, PM_KEL), join tables by id, and build basic fiber-level maps, use the lvm_dr20_helix_nebula_DAP_tutorial.ipynb notebook.
Example: Spectral Modeling
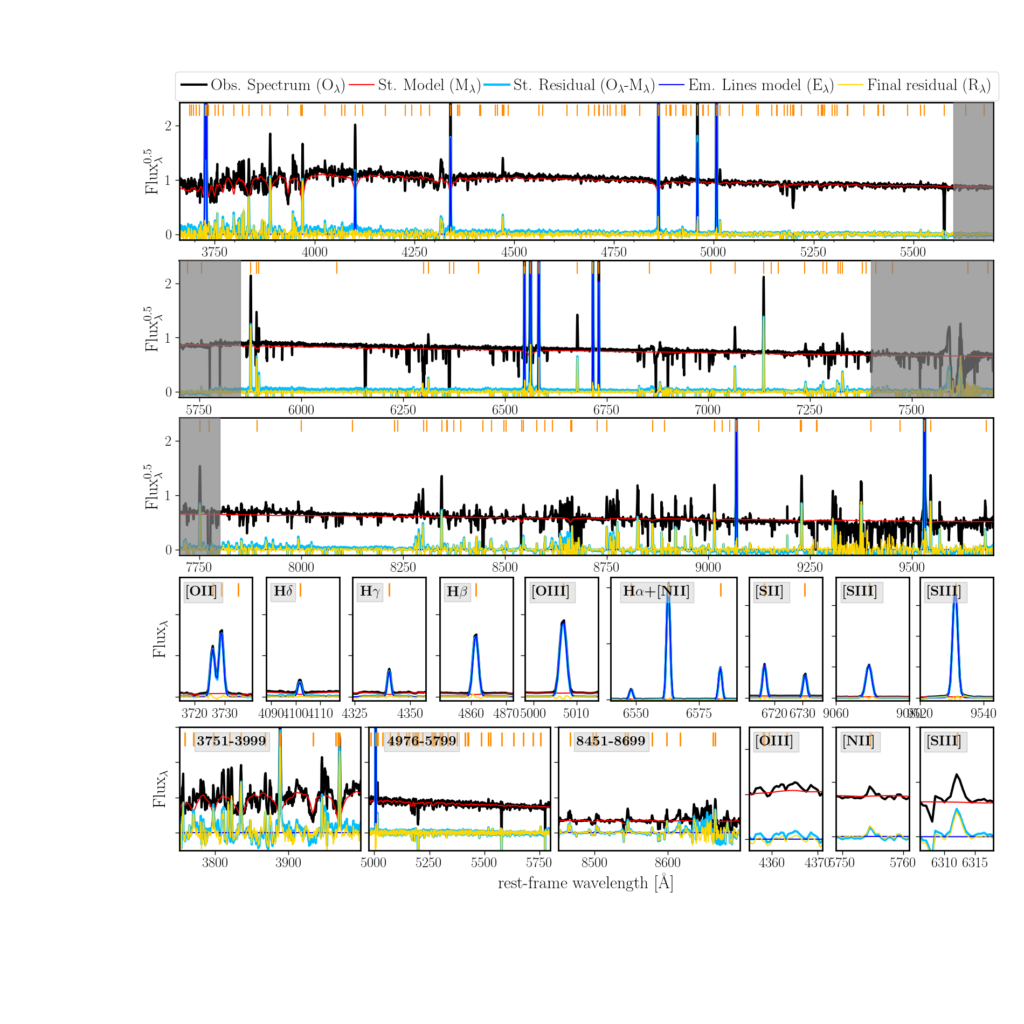
The DAP model file includes the ingredients needed to inspect the quality of the spectral modeling: the observed spectrum from the DRP file, the stellar-continuum model, the emission-line model, the gas-pure spectrum, and the residuals. You can either generage your own model using the DAP outputs or just inspect an existing model file.
Example: Emission-line Maps
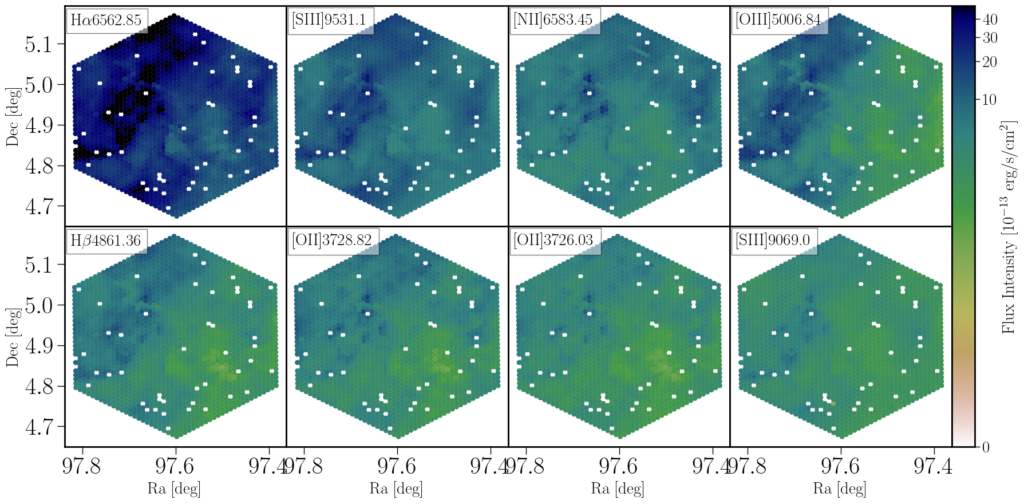
The DAP products can be used to construct spatially resolved maps of emission-line fluxes, velocities, velocity dispersions, equivalent widths, and line ratios. In the Rosette Nebula example, the DAP measurements recover the ionization structure stratification of the nebula (see Villa-Durango et al. 2025, for more details). You can use the lvm_dr20_helix_nebula_DAP_tutorial.ipynb and lvm_dr20_Mosaic_DAP_tutorial.ipynb notebooks for doing so.
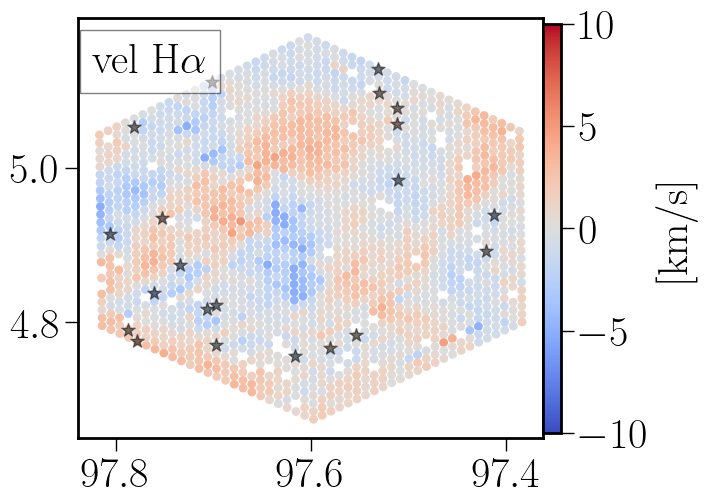
Example: Ionized-gas Kinematics
For strong emission lines, the parametric DAP measurements provide velocity and velocity-dispersion information.
Resolved Stellar Population Templates
The LVM-DAP uses Resolved Stellar Population, or RSP, templates to model the stellar component. This approach is different from standard single-stellar-population modeling because an LVM fiber can sample very different physical scales depending on the target distance. A fiber may contain no detectable star, one star, a few stars, or many stars. The RSP approach is designed to work across this regime.
The RSP templates used by the DAP are based on stellar spectra grouped both in physical-parameter space and in observed-spectral space. Each template is associated with a probability distribution of stellar parameters such as effective temperature, surface gravity, metallicity, and alpha abundance. These templates allow the DAP to model the stellar continuum while propagating information on the degeneracies of the stellar component. The current implementation adopts an RSP library of 108 templates built from the MaStar empirical stellar library (Yan et al. 2019), classified using the CoSha tagging code (Mejía-Narváez et al. 2021).
Users should keep in mind that the stellar-continuum quantities are most reliable when the stellar continuum has sufficient signal-to-noise. For low-continuum fibers, the stellar model is primarily intended to improve the recovery of the emission-line properties.
Local Volume Galaxy Products
For Local Volume galaxy targets, the standard DRP and DAP products preserve the foreground Milky Way contribution. This is intentional, because the Milky Way interstellar medium is itself a primary science target of LVM.
DR20 also includes experimental DAP products for Local Volume galaxies in which a foreground Milky Way subtraction procedure has been applied. These products are distributed in the same analysis directory as the remaining DAP files and use the naming convention:
LV_dap-rsp{#RSP}-sn{SN}-{EXPNUM}.dap.fits    , for the DAP-file
LV_dap-rsp{#RSP}-sn{SN}-{EXPNUM}.model.fits  , for the DAP model-file
For example:
LV_dap-rsp108-sn20-00005511.dap.fits      , for the DAP-file on exposure 5511
LV_dap-rsp108-sn20-00005511.model.fits    , for the DAP model-file on exposure 5511
These files are provided to help users evaluate the effect of the Milky Way foreground and explore the intrinsic properties of the extragalactic targets. They should be treated as experimental products.
Quality Control and Caveats
Users should consult the DR20 LVM quality-control information before performing quantitative analysis. The DR20 quality-control file provides flags for released exposures, including information related to observing conditions, calibration quality, sky subtraction, and DAP performance.
Software
The LVM-DAP software is publicly available on GitHub:
https://github.com/sdss/lvmdap
The repository contains the DAP Python package, configuration material, notebooks, data-model material, and command-line scripts. The main scripts include:
lvm-dap-conf: fits LVM-format FITS files using a predefined configuration file;lvm-dap-gen-out-mod: generates output models from spectral data;lvm-dap-sim: simulates spectral data based on predefined parameters;lvm-dap-yaml-edit: edits entries in a DAP configuration YAML file;lvm-dap-clean-st-mw: removes foreground Milky Way ISM and stellar contributions for Local Volume target analysis.
Most DR20 users do not need to run the pipeline from scratch. The recommended approach is to download the released DAP files from SAS, inspect the relevant Data Models, and follow the examples provided in the DR20 LVM tutorials.
For users who do want to run the pipeline locally, the DAP depends on pyPipe3D (Lacerda et al. 2022), which must be installed first. We recommend installing the LVM-DAP inside a clean Python 3.11 virtual environment, for example with conda:
conda create --name lvmdap python=3.11
conda activate lvmdap
git clone https://github.com/sdss/lvmdap.git
cd lvmdap
pip install . --user
A typical analysis run on a reduced LVM exposure is then launched with:
lvm-dap-conf lvmSFrame-EXPNUM.fits.gz dap-label config.yamlDetailed installation instructions, full documentation of all command-line tools and configuration options, and example datasets are provided in the GitHub repository.
References and Technical Papers
Users of the DR20 LVM-DAP products should cite the relevant SDSS data release paper, the LVM survey overview paper, the LVM-DAP paper, and the specific data-product or software papers appropriate for their analysis.
- Sánchez S. F., Mejía-Narváez A., Egorov O. V., et al. 2025, The SDSS-V Local Volume Mapper (LVM): Data Analysis Pipeline, AJ, 169, 52.
- Sánchez S. F., Méndez-Delgado J. E., Mejía-Narváez A., et al., SDSS-V Local Volume Mapper (LVM): Helix Nebula public data, Data Analysis Pipeline data products.
- SDSS Collaboration et al. 2026, The 20th SDSS Data Release (DR20).
- Mejía-Narváez A., et al., in preparation, The LVM Data Reduction Pipeline.
- Drory N., Blanc G. A., Kreckel K., et al. 2024, The SDSS-V Local Volume Mapper (LVM): Scientific Motivation and Project Overview, AJ, 168, 198.
- Lacerda E. A. D., Sánchez S. F., Mejía-Narváez A., et al. 2022, pyFIT3D and pyPipe3D: The new version of the Integral Field Spectroscopy data analysis pipeline, New Astronomy, 97, 101895.
- Mejía-Narváez A., Bruzual G., Sánchez S. F., et al. 2022, CoSHA: Code for Stellar Properties Heuristic Assignment—for the MaStar Stellar Library, ApJS, 261, 20.
- Yan R., Chen Y., Lazarz D., et al. 2019, SDSS-IV MaStar: A Large and Comprehensive Empirical Stellar Spectral Library—First Release, ApJ, 883, 175.