
LVMvis, located at https://dr20.sdss.org/lvmvis/, is an interactive browser-based interface for exploring data from the SDSS-V Local Volume Mapper. It provides direct access to LVM data in the browser, helping users understand what observations and data products are available for their targets. It brings together an Aladin Lite-based sky view, a table of LVM pointings, and a spectral viewer in a user-adjustable interface with movable and resizable panels.
LVMvis brings together three related but distinct data layers: DRP spectra from lvmSFrame files, DAP spectral models and emission-line measurements, and RGB HiPS visualization products. The RGB HiPS layer is optimized for fast visual exploration and survey navigation and should not be used for quantitative measurements.
What can you do in LVMvis?
- Browse and select LVM pointings as hexagons in Sky View or as rows in the Pointings Table, with selections synchronized across both views.
- Filter the pointings table using column-based conditions, including combined AND/OR logic, to find observations relevant to a target or sky region.
- Inspect fiber locations within a selected pointing.
- Compare LVM observations with public HiPS surveys available through Aladin Lite.
- Visualize the wide-field LVM color map, reduced spectra and corresponding best-fit model for the selected individual fiber.
Quick start
- Find an observation: select a hexagonal pointing in Sky View, or filter and select an exposure in the Pointings Table.
- Select a fiber: click one of the circular fiber apertures to load its spectrum in Spectrum View.
- Choose a data product: use the DRP/DAP selector to switch between the reduced DRP spectrum and the DAP best-fitting model.
Next steps: Use Export to save the filtered observation list, or Permalinks to share the selected exposure, fiber, sky position, or complete Sky View configuration.
On this page
General Interface Overview
LVMvis has a sidebar with settings and information, and a dashboard with movable panels displaying Sky View, the Pointing Table, and Spectrum View by default.
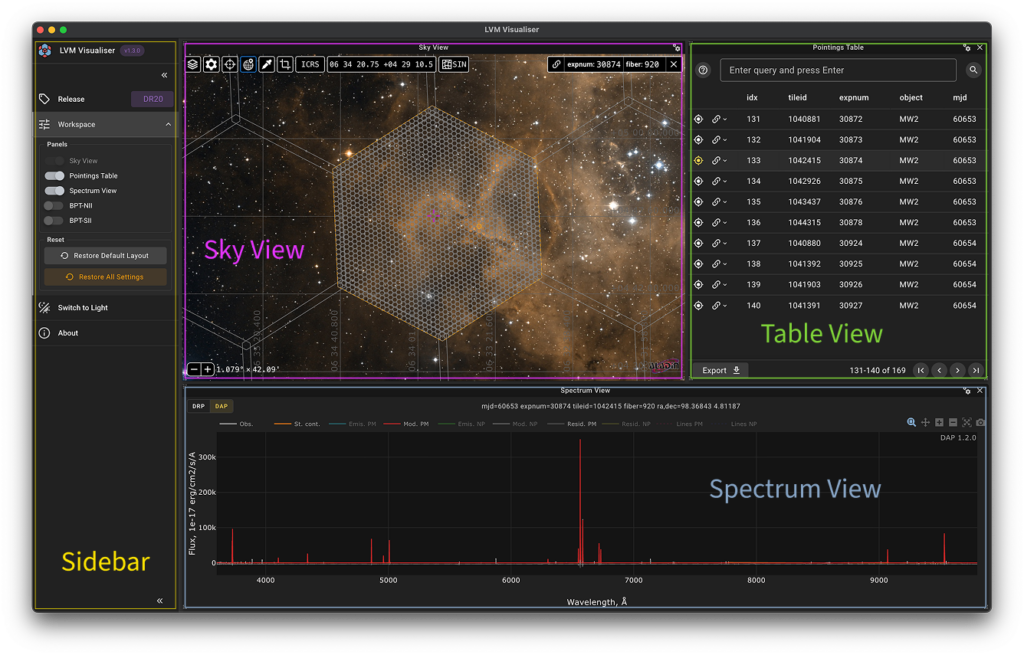
Understanding panel controls
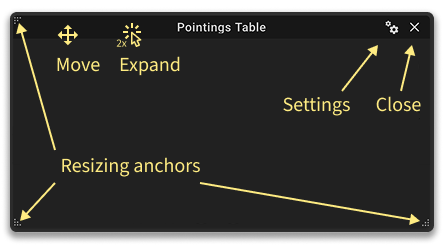
- Each panel has three resize handles.
- Drag the panel bar to move the panel.
- Double-clicking the bar expands the panel to fill all available space in the current layout.
- The settings button opens the panel’s dedicated settings.
- The cross closes the panel.
Sidebar
The sidebar includes sections showing information about the LVMvis version, Data Release version, Workspace settings, switching between Dark/Light themes, and opening the About modal window.
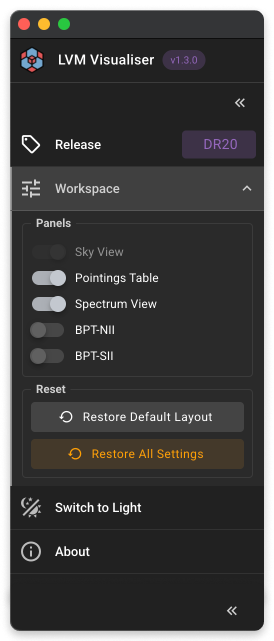
Sidebar mechanics: Click the LVMvis logo, any sidebar section except the theme switch, or the expand button to open the sidebar. Use the collapse button to close it.
The Release section currently includes only DR20 but will later feature a switcher between releases, defaulting to the latest public data release.
The Workspace section contains toggle buttons to switch the visibility of individual panels. If a panel was closed intentionally or accidentally, use this section to restore its visibility. Since the layout is fully customizable and can change during a user session, a button resets the layout to the default view shown above.
The Restore All Settings button returns the workspace layout and all user-configurable panel settings to their default values. LVMvis saves preferences such as the panel layout, spectrum line colors, and Aladin Lite hexagon colors in the browser, so they persist between sessions. Restore All Settings clears these saved preferences and restores the default configuration.
Sky View
Sky view is built on Aladin Lite and extends its features for the LVM survey. It displays the hexagonal field of view of each LVM exposure, the circular apertures of individual fibers, and HiPS image layers. The public DR20 interface includes one LVM-generated image layer: the LVM RGB HiPS map.
Note: The LVM RGB HiPS visualization includes observations beyond the DR20 spectroscopic data release. It is intended for qualitative visualization and survey navigation and should not be used for quantitative measurements.
Click the outline of an LVM hexagonal pointing to select the corresponding exposure in the Pointings Table. Conversely, selecting an exposure in the Pointings Table centers Sky View on that pointing.
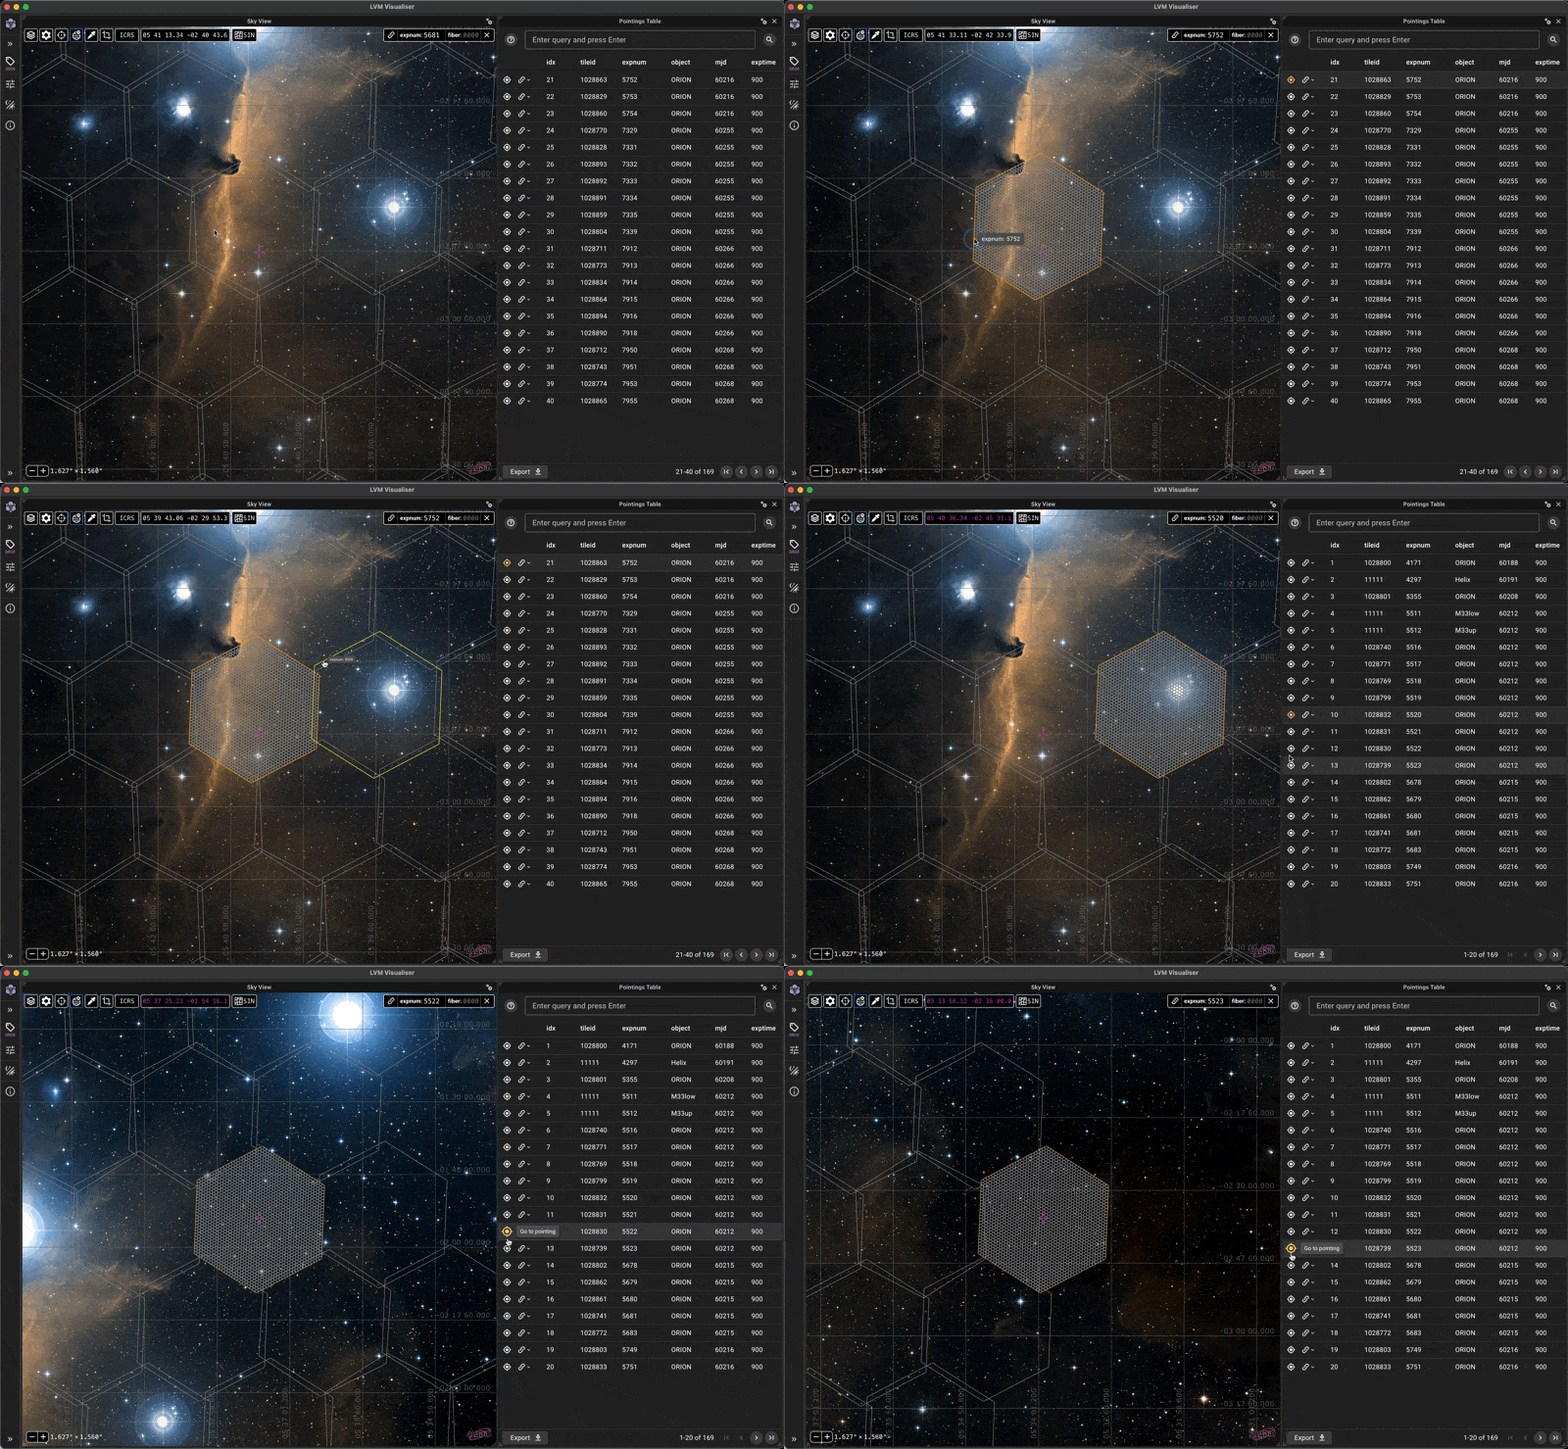
Circular fiber markers appear for the selected pointing. Each displayed fiber corresponds to an LVM aperture on the sky, not an image pixel. Adjacent fibers sample the nebula with the LVM hexagonal fiber geometry. You can hide the fibers via the Aladin Lite overlay control menu or Sky View settings. Clicking a fiber loads its spectrum into Spectrum View.
Sky View control elements

Stack Overlay Menu
Controls HiPS maps and overlays including LVM hexagons and fibers.

Aladin Settings
Opens Aladin Lite controls for the coordinate grid, reticle, and other viewer tools
SIMBAD Pointer Tool
When activated, clicking an object or sky position queries the SIMBAD database.

Coordinate Grid
Shows or hides the coordinate grid.

Pixel Value Extractor
Activates a mode that displays the value of the pixel under the pointer: numerical values for FITS HiPS maps and color codes for PNG/JPEG maps.
Image Cutout Form
Creates an image cutout from the selected HiPS map with custom size, projection, format, stretch, and colormap.

Coordinate Frame
Select the coordinate frame: equatorial, decimal equatorial, or Galactic.
View Projection
Select the sky projection, such as Tangential, Stereographic, Mercator, Hammer-Aitoff, or Mollweide.

Coordinates / Name Input
Enter sky coordinates or an object name. Object names are resolved through CDS, and Sky View navigates to the matched sky position.

Expnum / Fiber Form
Use this form to enter an exposure number (expnum) and, optionally, a fiber ID (fiberid). The adjacent link button  opens a dropdown menu with several permalink types. For example, the Exposure and Fiber option can create the permalink https://dr20.sdss.org/lvmvis/?expnum=4297&fiber=1648, which opens exposure 4297, loads the spectrum for fiber 1648, and centers Sky View on that fiber. See the Permalinks below for the complete list of permalink types and additional examples.
Stack overlays menu
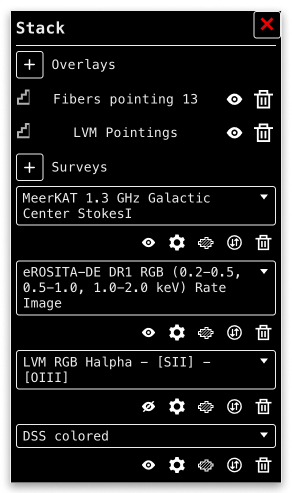
Overlays Stack is a key element of Aladin Lite that controls overlays shown on the sky. By default, Stack displays LVM pointing hexagons, circular LVM fibers, Digital Sky Survey (DSS) survey as background, and an LVM RGB map composed from Hα, [S II], and [O III] flux maps. More details about the LVM RGB HiPS map are given in the LVM color HiPS Map section.
Aladin Lite can load public HiPS surveys listed in the CDS HiPS aggregator. Select “+ Surveys” and then “Browse HiPS” to search the list and load another survey for comparison with LVM data.
Control buttons under each Survey layer manage visibility, transparency, dynamic range for FITS HiPS maps, flux cuts, and stretching functions. Once loaded, you can swap layers using the corresponding button.
Personal source catalogs can be added from the Stack menu: click “+ Overlays” → Catalogue → Load a VOTable file.
Users can load multiple layers into the Stack and customize settings such as stretch, cuts, and colormaps. LVMvis remembers these layers and settings in this browser and restores them automatically when they reload the page or open LVMvis in a new tab.
Image Cutout Form
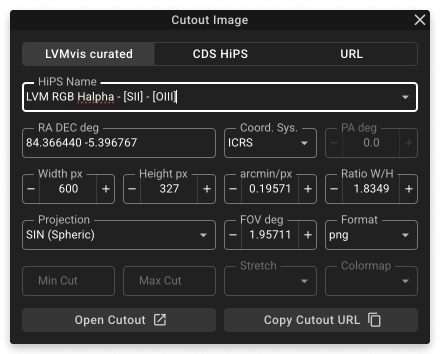
The Image Cutout form builds the request URL used to extract a rectangular image from a HiPS map. The content of the cutout image is determined by URL parameters specifying the selected map, sky position, projection, field of view, image size, output format, and rendering options. This functionality is built on top of the CDS hips2fits service and its underlying hips2fits-cutout script.
The form and Sky View are synchronized in both directions. Opening the form copies the current Sky View frame and visible HiPS layer, while subsequent changes in Sky View update the corresponding form fields. Conversely, changing the sky position, coordinate frame, projection, position angle, or field of view in the form adjusts Sky View, allowing the view to be configured more precisely. The Width and Height fields are different: they set the pixel dimensions of the generated cutout image and do not resize or change Sky View.
The available output formats depend on the selected HiPS map. A HiPS available in FITS format can produce either a FITS cutout or a rendered PNG/JPEG image. A HiPS available only as PNG/JPEG can produce raster image cutouts only.
Open Cutout sends the configured request and opens the image in a new tab. Copy Cutout URL copies the same request URL for reuse or sharing.
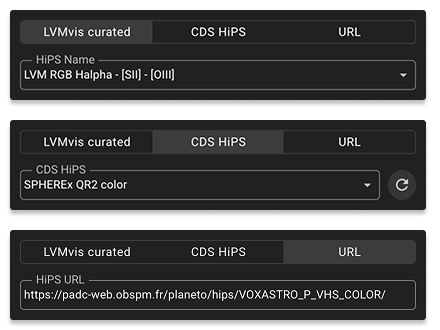
HiPS Map Sources include the following:
LVMvis curated – uses the curated LVMvis list, the same survey choices available in the Aladin Lite Stack Overlays Menu.
CDS HiPS – searches the CDS public HiPS list. Selecting a result builds a CDS hips2fits request.
URL – accepts an arbitrary public HiPS root URL for a map absent from the CDS search. LVMvis then builds its CDS hips2fits request URL.
Sky View Settings
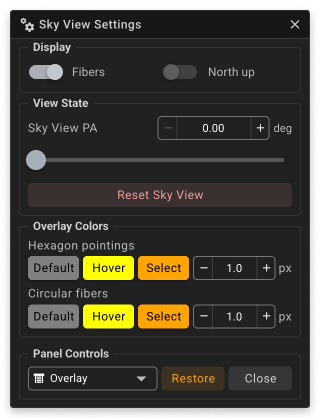
The Sky View settings panel has several sections.
The Display section has two switches. Fibers controls the visibility of the LVM fiber overlay in Aladin. The Stack menu can also hide the fibers without removing the overlay. North up keeps north (equatorial or Galactic, depending on the selected coordinate system) at the top of the Sky View. Disabling North up makes the view more flexible by allowing its positional angle to be changed, although the resulting orientation may be less predictable. This behavior is easiest to see with the SIN projection, labeled Spheric in the Aladin Lite menu, and a large field of view.
The View State section controls the orientation of the Sky View. Sky View PA sets the positional angle in degrees and takes effect only when North up is disabled. The angle can be adjusted using the slider or numeric input form. When a permalink containing a Sky View PA value is opened, North up is automatically disabled so that the requested positional angle can be applied. If the view becomes difficult to navigate, Reset Sky View restores the default SIN projection and resets the position angle to zero while preserving the current center and field of view.
The Overlay Colors section controls the appearance of the LVM hexagons and circular fibers. Users can change the default, hover, and selected colors, as well as the line width. The color picker supports HEX, HEXA, RGB, and RGBA formats, allowing both color and transparency to be configured.
The Panel Controls section is standard across all panel settings. The dropdown menu controls where the Settings panel appears: docked to a side of the parent panel, as an Overlay (the default), or as a Modal window covering the parent panel. Restore resets the options in the currently open Settings panel to their defaults, while Close closes the panel.
Permalinks
LVMvis permalinks provide several ways to share the selected hexagonal pointing and/or circular fiber or Sky View configuration. Open the permalink menu with the link button before the expnum / fiber form and choose which part of the current Sky View state should be included.
The menu contains five permalink types:
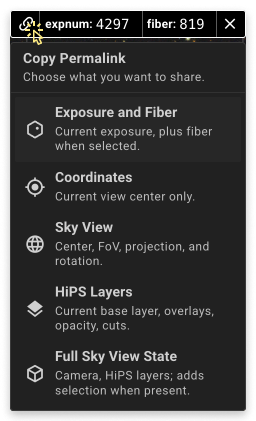
Exposure and Fiber — includes the selected exposure and, when present, the selected fiber. Opening the link loads the corresponding LVM data and navigates Sky View to the provided LVM pointing or individual fiber. The receiving browser retains its current or saved Sky View properties — including the field of view, projection, coordinate frame, position angle, and HiPS overlays — while only the target position and data selection are changed.
Coordinates — includes only the center of the current Sky View. Opening the link moves the recipient’s existing view to this position while retaining its field of view, projection, orientation, and HiPS stack.
Sky View — includes the center, field of view, projection, coordinate frame, and position angle, but not the HiPS layers. Opening the link applies this camera to the HiPS stack already saved in the receiving browser. This is useful for showing the same region, field-of-view and projection while allowing another user to inspect it with their own layer settings.
HiPS Layers — includes the current base layer and overlays, their order, opacity, cuts, stretch, and colormap settings when available. It does not include the Sky View location. Opening the link applies the shared stack to the position already saved in the receiving browser.
Full Sky View State — includes the Sky View position and HiPS stack together, and adds the current exposure and fiber selection when present. Use this option when the complete configuration should be reproduced.
The distinction between Sky View and HiPS Layers is important. A Sky View permalink moves the recipient’s current HiPS stack to the shared position and camera. A HiPS Layers permalink does the opposite: it applies the shared stack to the recipient’s current position and camera. If the receiving browser has no saved LVMvis state, the omitted parts use the normal LVMvis startup configuration.
Examples
Exposure and Fiber
https://dr20.sdss.org/lvmvis/?expnum=30817&fiber=428
This example selects exposure 30817 and fiber 428, loads the corresponding spectrum, and navigates Sky View to that fiber. It is useful for sending a colleague a direct link to the exact spectrum being discussed while preserving their existing Sky View and HiPS configuration.
Coordinates
https://dr20.sdss.org/lvmvis/?coords=06 29 15.80 +04 50 46.6
https://dr20.sdss.org/lvmvis/?ra=97.31583&dec=4.84628
https://dr20.sdss.org/lvmvis/?l=206.08521&b=-2.70229
These examples point to the same sky position using sexagesimal ICRS, decimal ICRS, and Galactic coordinates. They are useful for sharing a target position while allowing the recipient to retain their own field of view, projection, orientation, and HiPS layers.
Sky View
This example restores the specified center, field of view, Mollweide projection, and 30° position angle. It is useful for showing the exact Sky View field of view of a feature while leaving the recipient’s HiPS stack unchanged.
HiPS Layers
This example applies a two-layer stack containing allWISE imaging and the LVM RGB map, including their display settings, to the current Sky View. It is useful for reusing the same multi-wavelength visualization when examining several objects without changing the current position or camera.
Full Sky View State
This example restores exposure 30925 together with the Sky View and a two-layer stack containing the LVM RGB map and eROSITA X-ray imaging. It is useful when collaborators need to reproduce the complete data selection and multi-wavelength viewing context in one step.
Pointings Table
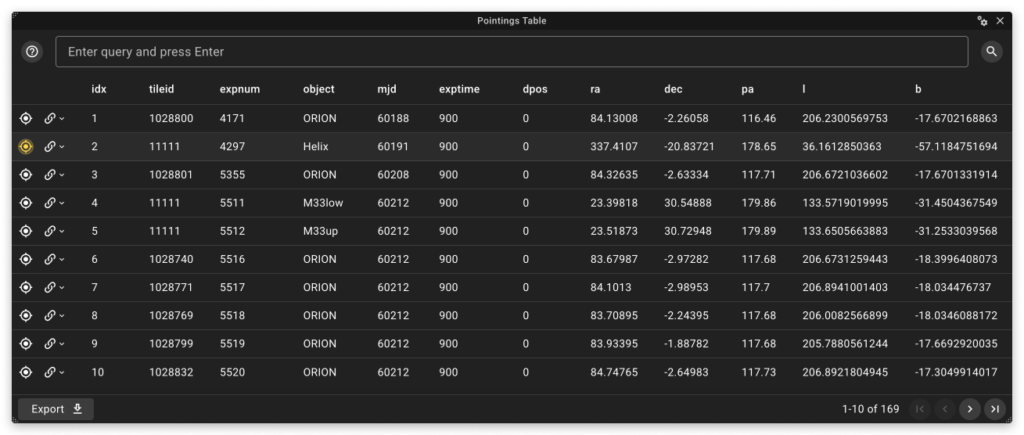
The LVM Pointings Table displays metadata for each LVM exposure available in LVMvis.
This component represents tables available on SAS as JSON lvmvis-analyzed.json or FITS lvmvis-analyzed.fits files.
Column description:
idx: Sequential number of the pointing in the table.tileid: Tile identifier for the observation. In this table,tileid = 11111identifies early-science observationsexpnum: Exposure number; unique identifier.object: Name or class of the observed target.mjd: Modified Julian Date of the observation.exptime: Exposure time in seconds.dpos: Dither position; the same tile can be observed multiple times. dpos is the index within the sequence of observations for that tile.ra: Right ascension of the central fiber, fiberID=975, in J2000 degrees.dec: Declination of the central fiber, fiberID=975, in J2000 degrees.pa: Position angle in degrees, measured from the central fiber (fiberID = 975) toward the reference corner fiber (fiberID = 3).l: Galactic longitude (deg).b: Galactic latitude (deg).
Table Controls
Click a column header to sort the interactive table by that column.
The zero column contains row actions: Goto button  centers/selects the pointing in Sky View. Reference link icon
  opens a drop-down menu with direct links to DRP and DAP files on SAS.
Pagination controls  appear at the bottom right, showing the current page range and total number of rows .
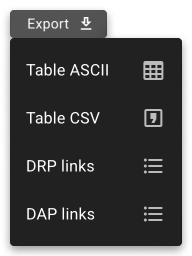
The Export dropdown in the bottom-left corner lets users download the current table selection as ASCII (lvmvis_pointings.dat), CSV (lvmvis_pointings.csv), or as lists of full SAS URLs for the corresponding DRP lvmSFrame files and DAP files. These URL lists can be used with commands such as wget -i lvmvis_DRP_urls.dat to download the selected data products directly.
Search Queries
The query input field  above the table allows flexible filters using column names as conditional expressions. After entering a search query, press Enter or click the search button to apply the filter. The Sky View updates to show only matching pointings. Export options apply to filtered records only. Use column names exactly as shown:
 idx, tileid, expnum, object, mjd, exptime, dpos, ra, dec, pa, l, b.
Query syntax examples
Basic Filters
Filter pointing with idx equal to 123:idx == 123
Note: Use == for equality; idx = 123 will not work.
Exclude tile number 11111 (early science targets):tileid != 11111
Text pattern search using non-strict equality:object ~= "NGC"
Matches pointings whose object name contains “NGC”.
Note: Strings must use double quotes; single quotes will not work.
Numeric Range Filters
Filter on the mjd column:mjd >= 60400
or60190 < mjd < 60213
The number of matching rows is shown in the table footer.
Advanced Filters
Combine multiple expressions using Boolean logic:(mjd >= 60400 and object ~= "NGC") or idx == 123
Note: Logical operators must be lowercase: and, or, and not.
Match target names from a list:object in ("Helix", "ORION")
Special Filters
Cone search around an ICRS position:cone(84.174, -1.292, 2.1)
The arguments are RA, DEC, and radius, all in degrees. This returns pointings whose centers are within 2.1° of the specified position.
Like any other condition, cone(…) can be combined with other expressions using lowercase and or or:cone(84.174, -1.292, 2.1) and mjd <= 60216
Using the q URL Parameter
The text in the filter field is stored in the page URL as the q parameter. Press Enter or click Search to apply it. When a URL containing q is opened, the filter is applied after the table loads. Clear the field, then press Enter or click Search to remove the filter and show all pointings.
NOTE: The Export menu saves the currently filtered table, not the full catalog. This lets you filter pointings in a region of interest and save only matching rows.
Spectrum View
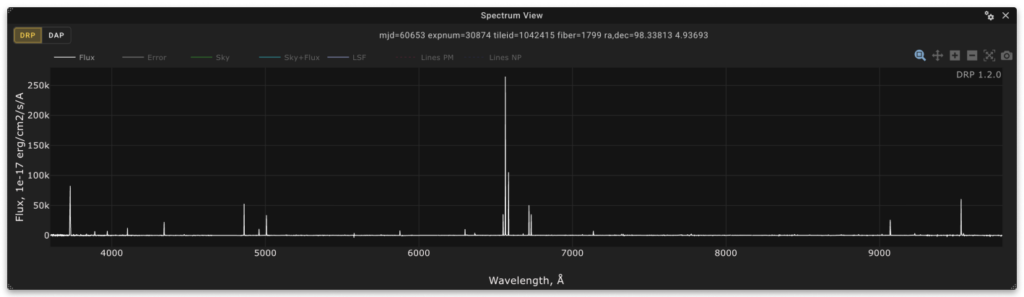
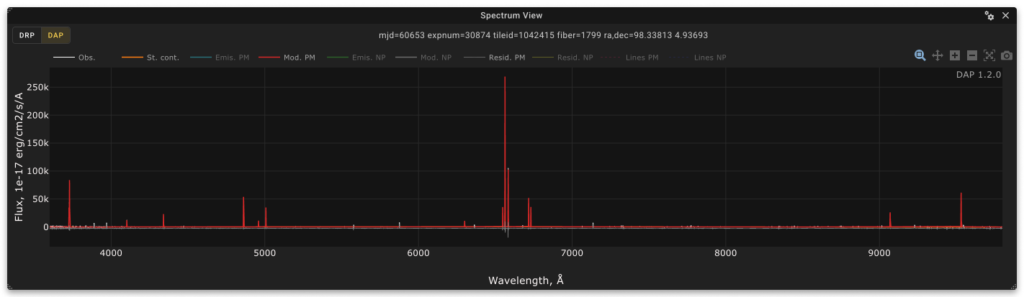
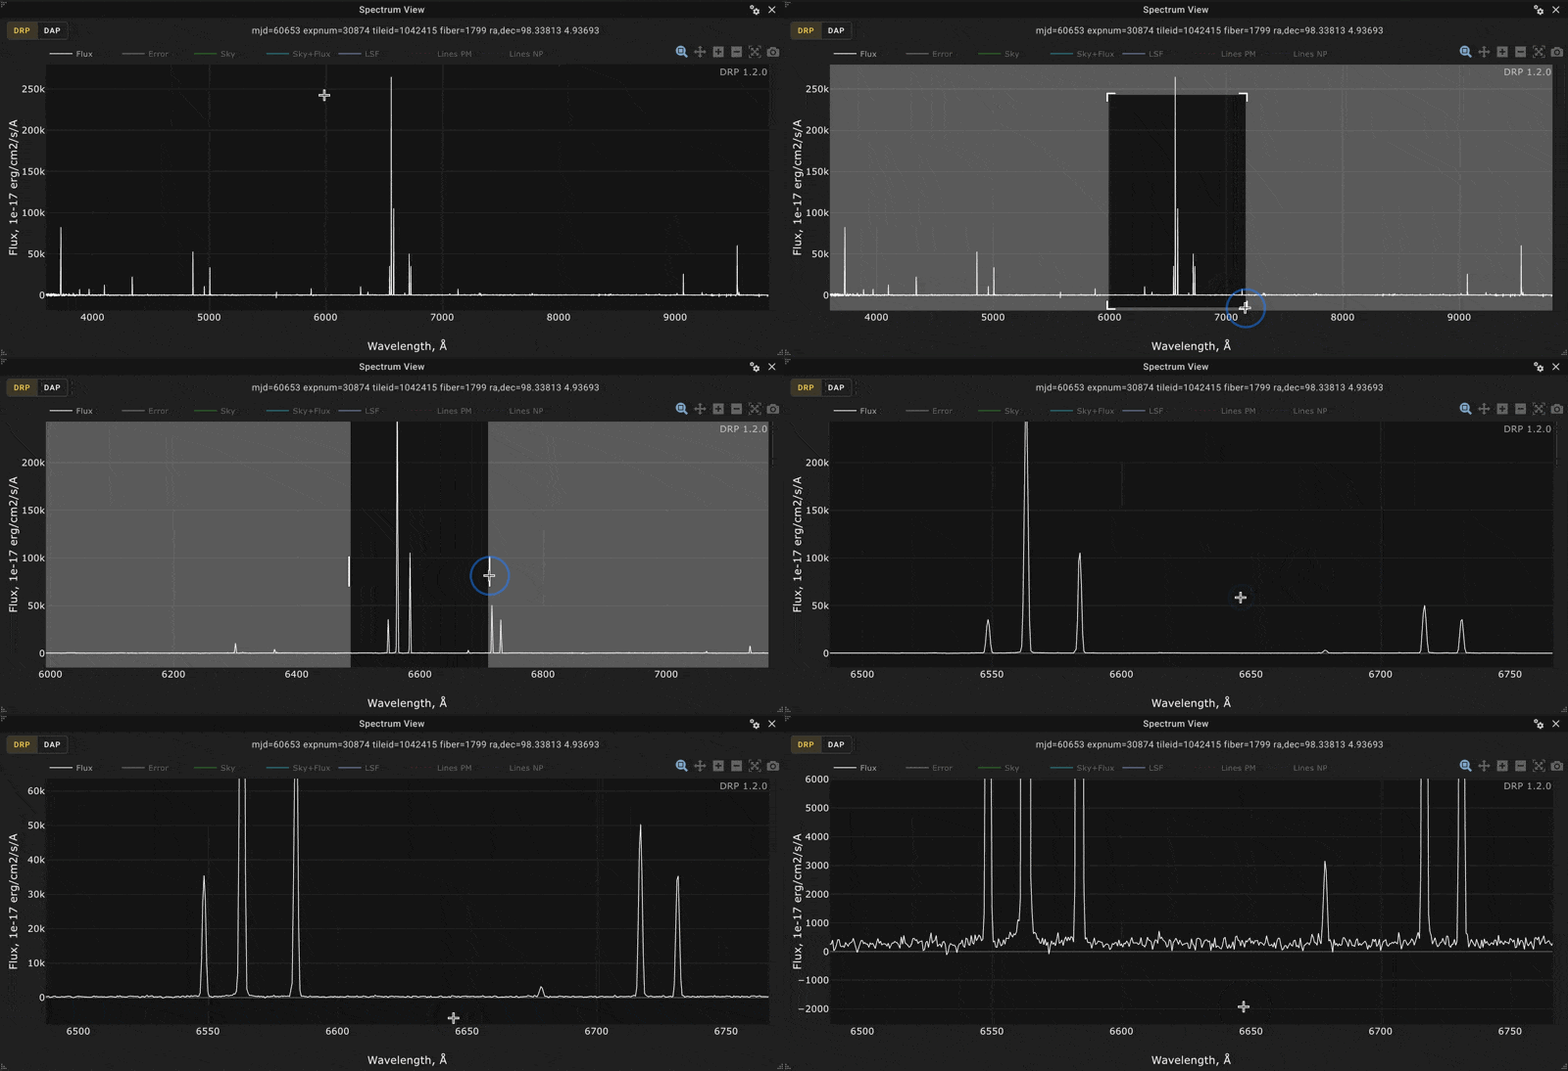
Spectrum View is an interactive plot of the spectrum for an individual fiber. It displays the spectrum for the selected fiber in the Sky View or specified via expnum/fiber form or permalink URL.
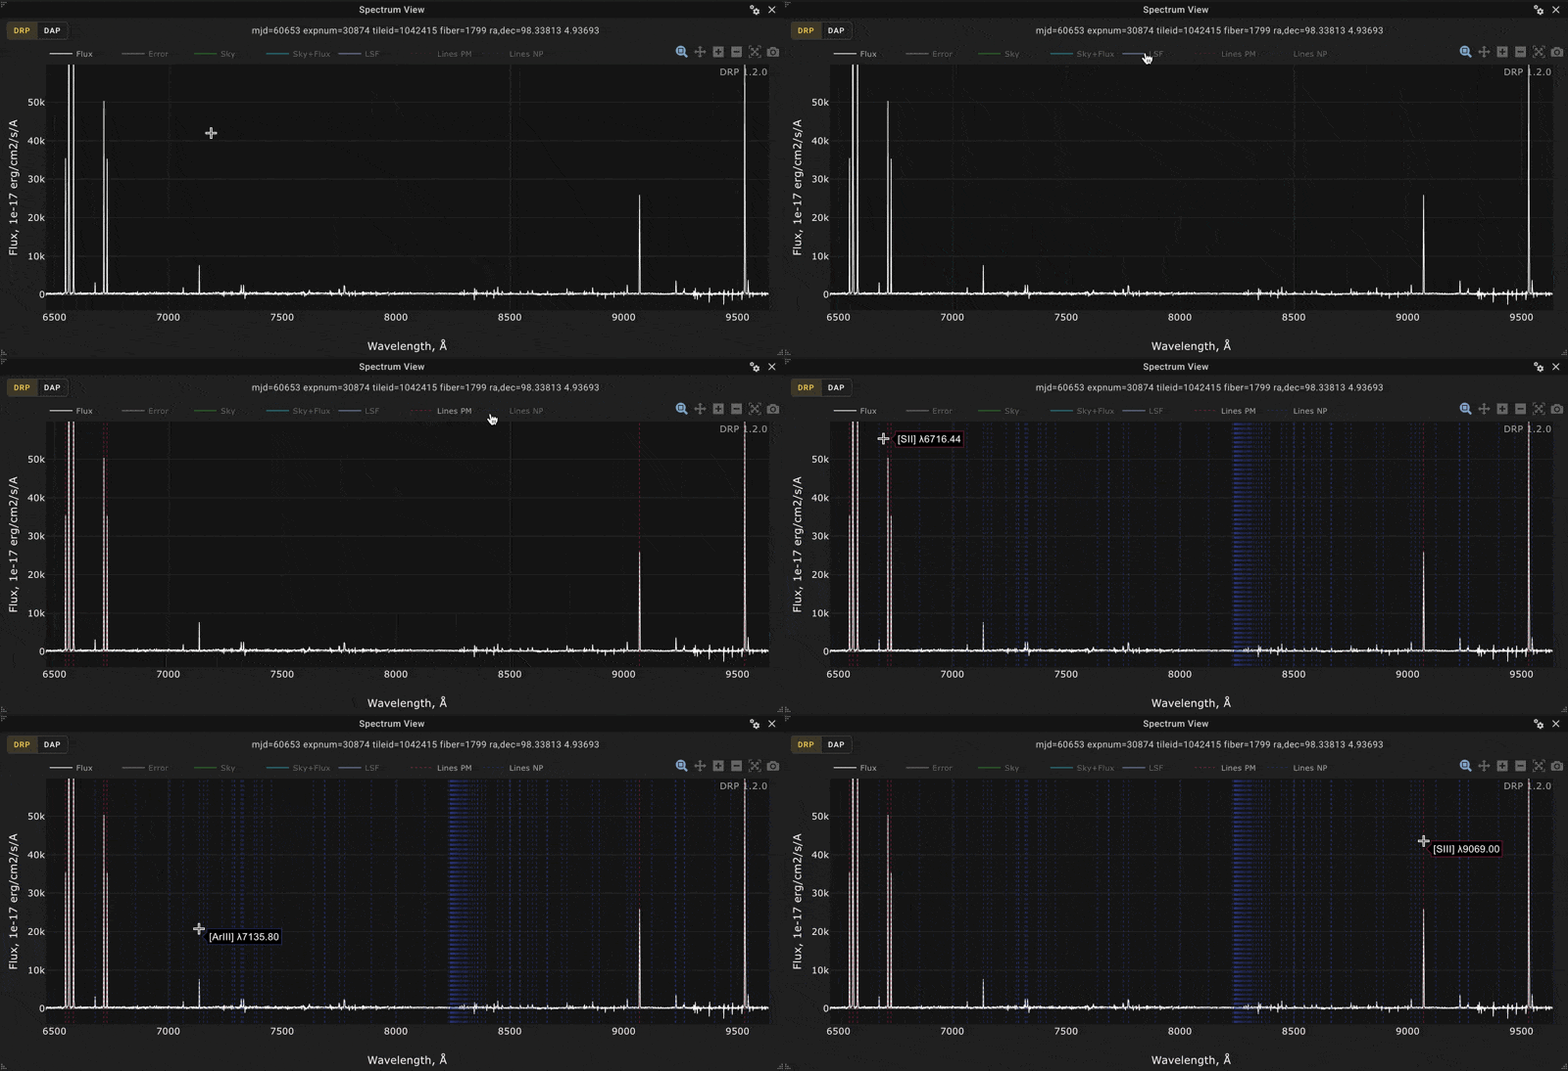
Two buttons  select whether Spectrum View displays DRP or DAP products for the selected fiber. DRP mode shows the reduced spectrum from the lvmSFrame FITS file, including the observed flux, error spectrum, sky spectrum, and line-spread function (LSF). DAP mode shows the observed spectrum together with the best-fitting stellar-continuum model and nebular emission-line model. The DAP also provides parametric emission-line measurements (PM), based on Gaussian modeling, and non-parametric measurements (NP), based on direct flux integration within wavelength windows. Read more about DAP modeling in the DAP page.
Spectrum Panel Settings
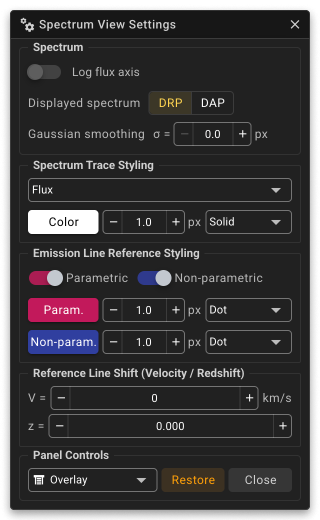
The spectrum panel opens via the two-gears button on the right side of the panel bar.
Spectrum section includes switches between linear flux, flux logarithm, and the DRP/DAP mode, duplicating the buttons in the spectrum panel. The smoothing Gaussian numeric input sets a Gaussian kernel to smooth the spectrum and all spectral components on the fly.
Spectrum Trace Styling section controls the appearance of the spectral component selected in the dropdown menu. Users can change its color, line width, and line style.
Emission Line Reference Styling section controls the visibility and style of vertical lines indicating emission line locations from lists used for parametric fitting and non-parametric modeling.
Reference Line Shift section allows specifying velocity shift or corresponding redshift of the vertical reference lines.
Panel Controls is a standard section of all Settings Panels. It includes options to position the Settings panel, a Restore button to reset all settings in the section, or to close the panel.
BPT diagrams
The optical emission-line diagnostic diagrams introduced by Baldwin, Phillips & Terlevich (1981) and extended to additional line ratios by Veilleux & Osterbrock (1987) are widely known as BPT diagrams. They compare strong optical emission-line ratios to help distinguish different gas-excitation mechanisms. In LVMvis, the BPT-NII panel plots [O III] λ5007/Hβ against [N II] λ6583/Hα, while the BPT-SII panel follows the Veilleux–Osterbrock extension and plots [O III] λ5007/Hβ against ([S II] λ6717 + [S II] λ6731)/Hα.
BPT diagrams are hidden by default. Enable the BPT-NII and BPT-SII panels from Workspace → Panels in the sidebar.
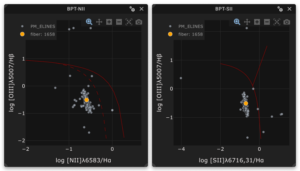
BPT panels display emission-line ratios from the parametric DAP emission-line product, PM_ELINES, for fibers in the selected exposure. The selected fiber is highlighted with a distinct marker. Clicking a point changes the selected fiber and recenters the Sky View.
The red curves show commonly used diagnostic demarcations. In the BPT-NII panel, the Kauffmann et al. (2003) empirical relation and the Kewley et al. (2001) theoretical maximum-starburst relation separate commonly used regions of the diagram. In the BPT-SII panel, the Kewley et al. (2001) relation marks the star-forming/AGN boundary, while the Kewley et al. (2006) relation separates the commonly used Seyfert and LINER regions.
BPT panels in LVMvis are intended for visual exploration, not as a final physical classification of individual fibers. Standard demarcation relations were developed primarily for integrated or idealized emission-line measurements and require particular care when applied to resolved LVM data. Diffuse ionized gas, shocks, low-S/N measurements, spatial mixing, and resolved nebular structures can move fibers across the displayed boundaries.
Use the BPT panel Settings menu to change marker size, color, opacity, and other available display options.
Development and Credits
LVMvis is a browser-based frontend application. Its development is led by Ivan Katkov (NYUAD/SAI MSU). LVMvis uses LVM-specific API endpoints provided through Valis, the SDSS-V API originally developed by Brian Cherinka (STScI). Development of LVMvis has been carried out with the support of the SDSS Data Team and the LVM Team.
The LVMvis frontend is built with Vue 3, TypeScript, and Vite. It uses Vuetify as its user-interface framework, Pinia for application state management, and Plotly.js for interactive plots. Sky View is built on Aladin Lite, developed at the Centre de Données astronomiques de Strasbourg (CDS) by Thomas Boch and Matthieu Baumann, with contributions from the wider Aladin Lite community.
Feedback, bug reports, and feature requests are welcome. Please contact Ivan Katkov.